
XEQT vs VEQT 2026: Which All-in-One ETF Is Better?
TL;DR: I would pick XEQT in this XEQT vs VEQT matchup — by a nose, not a mile. XEQT has the lower published MER today (0.19% against VEQT’s 0.22%), a lighter Canada weight I prefer (about 25.7% against about 30.7%), and quarterly distributions instead of one annual payout. VEQT wins if you want more Canada, more emerging markets, and Vanguard’s simpler four-fund structure with the broader official stock count. The headline other sites bury: both funds now charge the same 0.17% management fee after cuts in late 2025, so the published fee gap is mostly reporting lag. Over 30 years on $100,000, that gap is worth roughly $6,000 — real money, not life-changing. Pick on allocation and account fit, not slogans.
How We Compared XEQT vs VEQT
I compared XEQT vs VEQT on what decides a 20- or 30-year holding: cost, holdings, home bias, distributions, and TFSA versus RRSP treatment. Not a cherry-picked year of performance.
Every number was pulled from the official fund pages first: BlackRock Canada’s iShares XEQT fact sheet and ETF Facts, and Vanguard Canada’s VEQT product page and fact sheet. That matters here, because the internet disagrees with itself on this comparison — MERs of 0.20%, 0.22% and 0.24% are quoted for the same funds in the same month. The cause: both providers cut management fees in late 2025, and a published MER is backward-looking, so it takes quarters to catch up. Where a figure comes from an official sheet, I give its date. Where an official sheet does not publish a figure, I say so instead of borrowing a blog’s estimate.
Both funds do the same job: Toronto Stock Exchange-listed, Canadian-dollar, fund-of-funds portfolios targeting 100% equity and 0% bonds, built from broad index ETFs and rebalanced by the manager. If you need bonds, neither is for you. For the wider shortlist, see our guide to the best Canadian ETFs for beginners in 2026. Allocations drift between rebalances, so weights below are a dated snapshot — 31 October 2026 unless stated — not a promise.
XEQT: Full Review
XEQT is the iShares Core Equity ETF Portfolio from BlackRock Canada. It launched on 7 August 2019, is eligible for registered plans, and is the larger fund: net assets of $23,418.48 million on BlackRock’s fact sheet dated 31 October 2026.
What XEQT Holds
XEQT holds exactly five underlying iShares ETFs — that is the number of holdings BlackRock itself reports. As at 31 October 2026:
- U.S. exposure split across two underlying ETFs at 31.26% and 14.32% — a combined 45.58% in the United States
- iShares S&P/TSX Capped Composite Index ETF at 25.72% — Canada
- iShares Core MSCI EAFE IMI Index ETF at 24.14% — developed markets outside North America, such as Japan, the United Kingdom, France and Australia
- iShares MSCI Emerging Markets IMI Index ETF at 4.48% — emerging markets, plus a fraction in cash
BlackRock’s ETF Facts mix for 30 April 2026 agrees: U.S. equities 44.0%, Canadian 25.8%, international 24.6%, emerging markets 5.4%.
That Canada figure is the key design choice. Canada is a small single-digit share of world markets, so about 26% is a deliberate heavy home bias — just lighter than VEQT’s, and I prefer it: Canadian dividends in Canadian dollars, without letting one bank- and energy-heavy market drive nearly a third of your outcome.
On stock counts: BlackRock counts XEQT’s holdings as five — the underlying ETFs — and publishes no single official look-through stock count on the fact sheet checked. Treat any precise XEQT count elsewhere as an estimate. BlackRock describes XEQT as continuously monitored and automatically rebalanced, as needed.
XEQT Fees and Distributions
The management fee is 0.17%, cut from 0.18% effective 18 December 2025, and it includes the underlying ETF fees. The published MER on the October 2026 fact sheet is 0.19%. Earlier official documents showed 0.20%, because that MER covered a period before the cut flowed through. Both were official; only one is current. Remember that pattern — it explains VEQT too.
Distributions are quarterly. The October 2026 fact sheet puts distribution yield at 0.91% and 12-month trailing yield at 1.61%. Do not buy XEQT for that cash — it is a growth fund — but quarterly cash is more convenient if you reinvest manually.
XEQT Pros and Cons
Pros: Lower published MER today at 0.19%; management fee cut to 0.17%; lighter Canada weight at about 25.7% with more in developed international markets; quarterly distributions; larger fund at about $23.4 billion (31 October 2026).
Cons: Still a heavy Canada overweight versus world weights; emerging markets at about 4.5% is the thinner allocation here; no official look-through stock count on the fact sheet; 100% equity means full stock-market falls, uncushioned.
Not for you if…
- You want Canada near world-market weight — neither fund gives you that.
- You need monthly income — XEQT pays quarterly; see the best monthly income ETFs in Canada for 2026.
- You cannot watch a portfolio fall hard without selling — a balanced fund you hold beats an equity fund you panic-sell.
VEQT: Full Review
VEQT is the Vanguard All-Equity ETF Portfolio from Vanguard Canada. It launched on 29 January 2019, and Vanguard’s fact sheet dated 30 September 2026 puts total net assets at $17,528 million. Vanguard lists it as eligible across RRSP, RRIF, RESP, TFSA, DPSP, RDSP, non-registered and FHSA accounts.
What VEQT Holds
VEQT uses four underlying Vanguard funds — one fewer than XEQT — and Vanguard is more forthcoming with look-through detail: 13,936 stocks on the fact sheet for 30 September 2026, and 14,148 total holdings with 13,900 stocks on the product page as at 31 October 2026. Those official figures make VEQT the broader fund on the breadth metric that can be measured for both.
The underlying allocation as at 31 October 2026, from Vanguard’s product page:
- Vanguard Morningstar U.S. Total Market Index ETF at 45.26% — United States
- Vanguard FTSE Canada All Cap Index ETF at 30.73% — Canada
- Vanguard FTSE Developed All Cap ex North America Index ETF at 17.27% — developed markets outside North America
- Vanguard FTSE Emerging Markets All Cap Index ETF at 6.73% — emerging markets
Vanguard’s market allocation lines up: United States 45.40%, Canada 30.79%, Japan 4.18%, United Kingdom 2.27%. Both funds hold about 45% in the U.S., then diverge: VEQT takes about five points more Canada and about one and a half points more emerging markets, paid for with about seven points less in developed international markets.
My take: that roughly 31% Canada weight is the biggest reason I rank VEQT second. Canada’s market is dominated by financials, energy and materials, so at 31% a banking or oil shock is a portfolio event, not a regional one. Choosing it deliberately is defensible — it is not a free lunch. Its 6.7% emerging markets weight is the more world-like choice, and its all-cap funds reach further into smaller companies. Vanguard says the portfolio may be reconstituted and rebalanced from time to time at the sub-advisor’s discretion — a looser formulation than XEQT’s automatic rebalancing.
VEQT Fees and Distributions
This is where other sites get confused. Vanguard cut VEQT’s management fee from 0.22% to 0.17%, effective 18 November 2025 — so VEQT and XEQT now charge an identical 0.17% management fee. The published MER on Vanguard’s September 2026 fact sheet is 0.22%; the footnote explains why: that MER is as of 31 March 2026, from a period still including months at the old fee. Pages quoting 0.24% read an even earlier period. VEQT’s published MER should be expected to drift down as post-cut periods replace pre-cut ones — but only future MERs will confirm the figure, so I am not printing a forecast as fact.
Distributions are annual — official, on both product page and fact sheet, and the clearest practical difference here. For 2025: an income payment of $0.76018 per unit plus a reinvested capital gains distribution of $0.24252 per unit, ex-dividend date 30 December 2025, payment date 7 January 2026. Cash for manual reinvestment arrives once a year instead of four times, and the reinvested piece is non-cash — in a non-registered account it can appear on a tax slip without cash to pay the bill. Inside a TFSA or RRSP, it does not matter.
VEQT Pros and Cons
Pros: Management fee cut to 0.17%, matching XEQT; official breadth of 13,936 stocks (30 September 2026); simpler four-fund structure; higher emerging markets weight at about 6.7%; all-cap funds; a deliberate larger Canada anchor.
Cons: Published MER still 0.22% because it predates the full effect of the cut; annual distributions only, with a possible non-cash capital gains component; Canada at about 30.7% is heavy concentration; less developed international exposure at about 17.3%.
Not for you if…
- You hold it non-registered and dread tax-slip surprises — the annual reinvested capital gains distribution is that risk.
- You want distributions more than once a year.
- You think a global portfolio should look like the world — VEQT’s roughly 31% Canada is furthest from world weights here.
- You need bonds — that is a different Vanguard fund.
The Fee Gap, Done Properly: 30-Year Fee-Drag Maths
Here is the fee arithmetic in the open. This is an illustration, not a forecast.
Inputs. Published MERs from the latest official sheets: XEQT 0.19%, VEQT 0.22%. Difference: 0.03 percentage points — three basis points, or $30 a year on $100,000. Management fees are now identical at 0.17% each, which is why I expect the published gap to narrow.
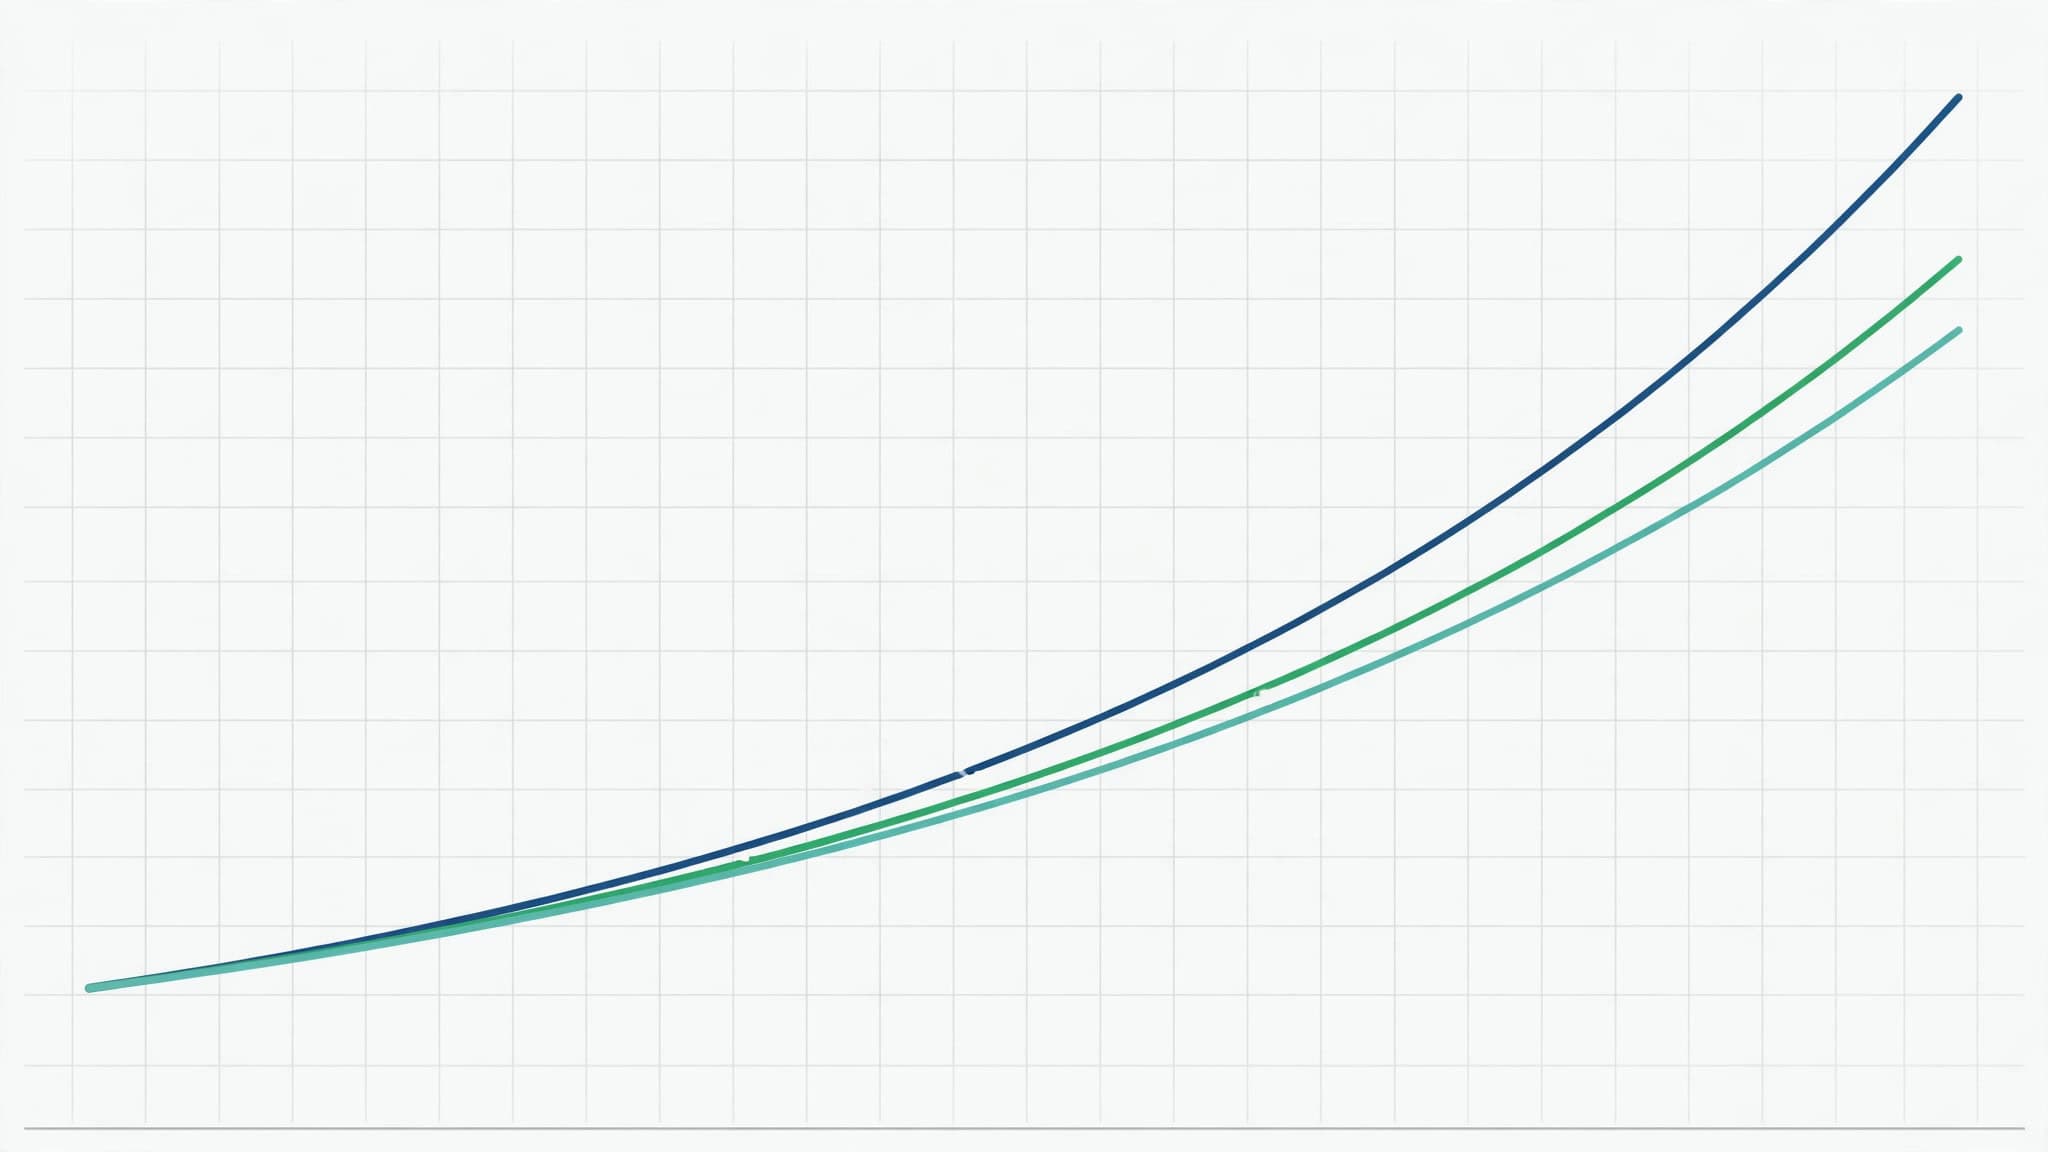
Illustration. $100,000, nothing added, an assumed 7% gross annual return before fund fees for 30 years — an assumption chosen to make the maths readable, not a prediction — with each MER deducted each year:
- No fund fee at all: $100,000 at 7% for 30 years grows to about $761,226.
- XEQT at a 6.81% net return (7% minus 0.19%): about $721,701. Fees cost roughly $39,524 of potential growth.
- VEQT at a 6.78% net return (7% minus 0.22%): about $715,645. Fees cost roughly $45,581.
- Difference between the two funds: about $6,056 over 30 years on $100,000.
Both readings are true. Six thousand dollars is real money. It is also about $200 a year on average, on a portfolio that grew by more than $600,000 in this illustration, and it rests on a gap that is partly a reporting-date artefact. If VEQT’s published MER settles near XEQT’s once the 0.17% fee runs through a full period, most of the $6,056 disappears. Fees are a tiebreaker, not a headline. If fees keep you up at night, the honest alternative is building the same portfolio from cheaper single-region ETFs and rebalancing it yourself, forever, without slipping. Most people slip.
XEQT vs VEQT: The Comparison Table
| Feature | XEQT | VEQT |
|---|---|---|
| Full name | iShares Core Equity ETF Portfolio | Vanguard All-Equity ETF Portfolio |
| Provider | BlackRock Canada (iShares) | Vanguard Canada |
| Inception date | 7 August 2019 | 29 January 2019 |
| Target allocation | 100% equity | 100% equity |
| Management fee | 0.17% (cut from 0.18%, effective 18 Dec 2025) | 0.17% (cut from 0.22%, effective 18 Nov 2025) |
| Published MER | 0.19% (fact sheet, 31 Oct 2026) | 0.22% (as of 31 Mar 2026; fact sheet 30 Sep 2026) |
| Net assets | $23,418.48 million (31 Oct 2026) | $17,528 million (30 Sep 2026) |
| Underlying funds | 5 iShares ETFs | 4 Vanguard ETFs |
| Look-through stocks | Not published as a single figure on the BlackRock fact sheet (holdings counted as 5 ETFs) | 13,936 stocks (fact sheet, 30 Sep 2026) |
| United States weight | About 45.6% (two U.S. ETFs combined, 31 Oct 2026) | 45.26% underlying fund; 45.40% market allocation (31 Oct 2026) |
| Canada weight | 25.72% (31 Oct 2026) | 30.73% underlying fund; 30.79% market allocation (31 Oct 2026) |
| Developed ex-North America | 24.14% in EAFE IMI ETF (31 Oct 2026) | 17.27% in Developed ex-North America fund (31 Oct 2026) |
| Emerging markets | 4.48% (31 Oct 2026) | 6.73% (31 Oct 2026) |
| Distribution frequency | Quarterly | Annually |
| Rebalancing (official wording) | Continuously monitored and automatically rebalanced, as needed | Reconstituted and rebalanced from time to time at sub-advisor’s discretion |
| Exchange / currency | Toronto Stock Exchange / CAD | Toronto Stock Exchange / CAD |
Sources: BlackRock Canada XEQT fact sheet (October 2026, as at 31 October 2026) and ETF Facts (19 June 2026); Vanguard Canada VEQT product page (as at 31 October 2026) and fact sheet (30 September 2026). Figures change — check current official sheets before investing.
TFSA vs RRSP: The Withholding-Tax Nuance
This is general education, not tax advice. U.S. dividends are generally subject to 15% withholding tax for Canadian investors under the Canada–U.S. tax treaty. What happens next depends on the account and the structure of what you hold.
In a TFSA, there is no treaty exemption for U.S. dividends. The 15% on the U.S. portion is taken before it reaches you and is not recoverable — for XEQT, VEQT, and a U.S.-listed ETF held directly in a TFSA alike. On a roughly 45% U.S. weight that is a modest drag on the dividend portion of return in either fund — not a reason to avoid U.S. equities in a TFSA, and not a separator between these funds. Our guide to the best ETFs for a TFSA in Canada in 2026 works through asset location in full.
In an RRSP, the treaty does exempt U.S. dividends — but cleanest when you hold a U.S.-listed ETF or U.S. stocks directly in the RRSP. XEQT and VEQT are Canadian-listed, their U.S. dividends arrive through underlying fund structures, and withholding applied at fund level cannot be reclaimed yourself. A Canadian-listed all-in-one fund in an RRSP does not deliver the full treaty benefit of a direct U.S.-listed holding. That applies to both.
At the margin, XEQT holds part of its U.S. exposure through a U.S.-listed underlying ETF, while VEQT’s U.S. exposure comes through a Canadian-listed underlying fund, and international dividends face their own withholding layers in both. That can produce a small difference in drag, in XEQT’s favour on the U.S. sleeve in some analyses — but neither provider publishes an official withholding-drag figure, so I will not put a decimal point on it. Treat it as a minor point for XEQT, not a decision-maker. Where you buy also affects costs: our Questrade vs Wealthsimple comparison for 2026 covers commission-free ETF buying, which matters more to most small accounts than any nuance here.

How to Choose Between XEQT and VEQT
Work through these questions in order — they settle XEQT vs VEQT faster than any spreadsheet.
- How much Canada do you want? The real decision. About 26% (XEQT) is already a strong home tilt; about 31% (VEQT) is stronger. If your job, house and spending are all Canadian, you are already long Canada — I would take the lighter tilt. If you deliberately want the anchor and accept the bank-and-energy concentration, VEQT expresses that view honestly.
- Where will you hold it? TFSA: either works. RRSP: either works, and neither gives the direct U.S.-listed treaty advantage. Non-registered: XEQT’s quarterly cash is tidier than VEQT’s annual payment with its possible non-cash component, pushing me further toward XEQT for taxable accounts. If taxable yield is your goal, start with the best high dividend ETFs in Canada for 2026.
- Do distributions fit your routine? Manual reinvestment or a preference for quarterly payments favours XEQT. Fully automated and untouched for a year, VEQT’s annual payment costs you nothing you will notice.
- Breadth or regional balance? VEQT holds more stocks and more emerging markets; XEQT holds more developed international and less Canada. Neither is more diversified in every dimension — they diversify differently.
- Will you stay the course? Both will fall hard in a bad market. The best fund is the one you will keep buying through a 30% drawdown. That conviction is worth more than three basis points.
Still torn? Default to XEQT, automate the contribution, and spend the saved time on your savings rate.
FAQ
Is XEQT or VEQT cheaper?
On management fee, tied at 0.17% — XEQT cut from 0.18% effective 18 December 2025, VEQT from 0.22% effective 18 November 2025. On published MER, XEQT is cheaper today at 0.19% against 0.22%, but VEQT’s figure is dated 31 March 2026 and still reflects the old fee for part of its period. Expect the gap to narrow; do not treat 0.22% as permanent.
What is the biggest difference between XEQT and VEQT?
Home bias and distributions. VEQT holds about 30.7% in Canada against XEQT’s about 25.7%, holds more emerging markets, and pays annually. XEQT pays quarterly. U.S. weights are nearly identical at about 45%.
Which is better in a TFSA, XEQT or VEQT?
Either works, and 15% U.S. dividend withholding applies inside a TFSA for both, with no recovery. Choose on Canada weight and distributions. I default to XEQT.
Which is better in an RRSP?
Neither Canadian-listed fund captures the full treaty exemption on U.S. dividends that a directly held U.S.-listed ETF can achieve in an RRSP, because withholding is applied within the fund structure. That shared limitation matters more than their small structural difference, so choose on allocation. This is education, not tax advice.
Can I switch from one to the other?
In a TFSA or RRSP it is a sell and a buy inside the account, though TFSA rules still apply and are yours to check. In a non-registered account, selling can trigger capital gains tax. Switching to chase three basis points is rarely worth it; switching over Canada weight can be.
Should I hold both XEQT and VEQT?
No — not for diversification. They own substantially the same global market through different wrappers, so holding both adds statements, not diversification. Pick one.
Final Verdict
XEQT vs VEQT is close, and that closeness is the finding. Same job, same 100% equity target, same roughly 45% in the United States, and — after the late-2025 cuts — the same 0.17% management fee. XEQT wins more of what remains: published MER 0.19% against 0.22% today, Canada at about 25.7% against about 30.7% that I consider better judged, more developed international exposure, quarterly distributions instead of an annual payment with a possible non-cash tax wrinkle, and the larger asset base.
VEQT is the pick if you want Vanguard’s four-fund simplicity, the broadest official stock count at 13,936 holdings, a heavier emerging markets weight, and a portfolio deliberately anchored in Canada. Choosing VEQT for those reasons is a good decision. Choosing either fund because a stale page quoted old MERs is a decision on expired data — which is why this comparison needed redoing from the official sheets.
If I were funding one account today, I would buy XEQT, automate the contribution, and not revisit this for five years. The winners with either fund will be those who picked a good ticker, kept contributing, and left it alone.
Educational disclaimer: This article is for education only and is not financial advice or a solicitation to buy or sell any security. All-in-one equity ETFs can fall substantially, and past performance does not guarantee future results. Fees, allocations, assets and distributions change — verify current figures on the official BlackRock Canada and Vanguard Canada pages before investing.
Tax note: Comments on withholding tax, TFSAs, RRSPs and distributions are general information, not tax advice. Consult a qualified tax professional before acting on any tax point here.
Affiliate disclosure: This article may contain affiliate links to brokerages. If you open an account through them, we may earn a commission at no extra cost to you. Brokerage offers change, so confirm current terms before opening an account.