

The Bitcoin Power Law Explained: The Hidden Pattern Behind Price Movements showcases a remarkable mathematical pattern in cryptocurrency price movements. Bitcoin’s price follows a power law with an exponent of approximately 5.8. This suggests that its valuation grows exponentially as the network gains more users. The pattern shares similarities with natural processes that mathematical laws regulate, which makes Bitcoin’s price behavior predictable consistently.
The bitcoin power law chart demonstrates this mathematical relationship clearly. Mathematical projections for early 2026 had suggested Bitcoin reaching approximately $210,000 and later correcting to around $60,000 that year. However, Bitcoin’s price in January 2026 was approximately $40,000-$50,000, not $210,000, indicating these specific short-term projections did not materialize. The bitcoin formula’s long-term projections still point to a maximum price of $1 million by 2033. This theory goes beyond price predictions. Bitcoin’s network shows similar power law relationships – addresses follow an exponent of 3, while the hash rate displays a dramatic relationship with an exponent of 12. This piece explores the power law bitcoin relationship, its implications for Bitcoin’s future, and why it offers a more reliable framework than traditional models to understand Bitcoin’s growth, especially following the 2024 halving event.
Understanding the Bitcoin Power Law Equation
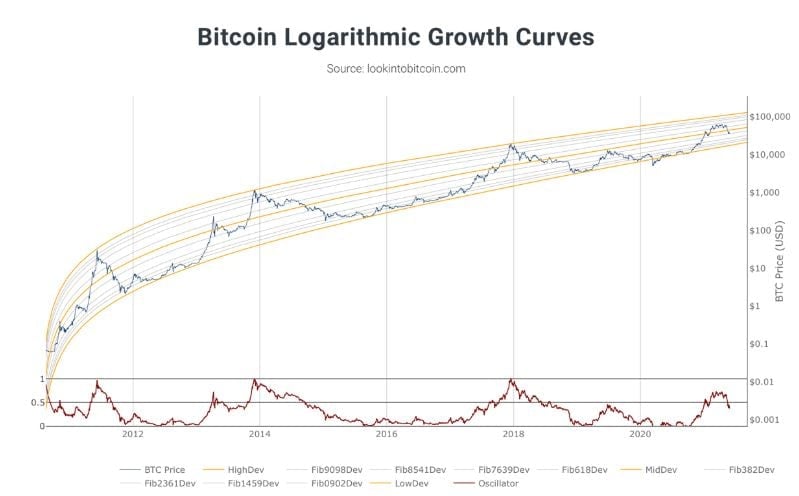 Image Source: Bitcoin.com News
Bitcoin’s price movements follow a predictable pattern called a power law. Italian physicist Giovanni Santostasi developed the bitcoin power law. This framework helps us understand Bitcoin’s price behavior better than traditional financial models1.
Price = A*(t – t₀)^n: Core formula breakdown
The bitcoin formula behind this theory is simple:
Price = A(t – t₀)^n
Where:
- Price represents Bitcoin’s value in USD
- A is a scaling factor (a constant)
- t is the current time
- t₀ is the original time (Bitcoin’s genesis)
- n is the exponent that defines the curve’s shape
Bitcoin’s growth isn’t linear or purely exponential like conventional assets. The power law relationship shows that Bitcoin’s price grows proportionally to the time since its creation, raised to a power2. This matches how Bitcoin behaves more like a growing organism or network than a traditional financial instrument3.
The formula captures something key: Bitcoin’s adoption and value growth match mathematical patterns we see in natural systems and network technologies. What looks like chaotic price movement actually follows predictable mathematical principles1.
Log-log transformation and linear regression fit
Economists and researchers transform both axes to logarithmic scales to analyze this relationship properly. This creates what we call a log-log graph32. The transformation matters because it:
- Shows patterns hidden in the data
- Turns the power function into a linear relationship
- Lets us analyze exponential growth properly
The power law equation becomes this after logarithmic transformation: log(Price) = log(A) + n·log(t – t₀)
This change reveals a clear linear relationship between log price and log time2. Bitcoin’s price history looks completely different on a logarithmic scale versus a linear one. Price swings that seem extreme on a linear chart appear as a smooth upward trend on a log-log chart9.
The bitcoin power law chart uses this log-log regression to set support and resistance bands33. Bitcoin’s price moves consistently within these bands. Data from 2011 shows a clear linear trend in this log-log space2. Price corrections show up as temporary moves away from the main trend line.
Exponent n ≈ 5.8: What it means for Bitcoin growth
The sort of thing i love about the bitcoin equation is the exponent n’s value, which data shows is about 5.81. This number tells us a lot about Bitcoin’s growth path.
The 5.8 exponent emerges from several other power law relationships in the Bitcoin ecosystem3:
- Bitcoin addresses grow proportionally to t^3 (time cubed)
- Bitcoin’s price scales with address numbers raised to ~2 (following Metcalfe’s Law)
- These effects combine to create the observed power law: t^3 × 2 ≈ t^6 ≈ 5.8
This relationship shows the connections between Bitcoin adoption, network effects, and price. Bitcoin’s price growth reflects how it spreads9. Network effects amplify this as each new user adds more value to the network.
The bitcoin power law gives investors and analysts a way to see price movements in a longer-term context. Short-term volatility matters less against this backdrop9. The theory suggests Bitcoin’s growth pattern will stay scale-invariant – the same mathematical relationship should hold as the network grows3.
Several websites let you see this pattern through live bitcoin power law charts with historical price data and trend lines. These charts show resistance and support bands from the log-log regression. They help put current price movements in context33.
Materials and Methods: Building the Bitcoin Power Law Chart

Image Source: DataDrivenInvestor
Building a Bitcoin power law chart that’s accurate needs specific data, the right scaling methods, and specialized tools. Let me walk you through the steps needed to build a chart that shows Bitcoin’s price history’s mathematical patterns.
Data sources: CoinMarketCap, Glassnode, and blockchain explorers
You need reliable historical price data to create a good Bitcoin power law chart. Here are the main data sources:
CoinMarketCap has the most available historical price data with daily closing prices from Bitcoin’s early days. You can get this data through their API or download CSV files directly6. My analysis uses Bitcoin’s complete USD price history, updated to the present, to capture the power law relationship through all market cycles.
Glassnode’s on-chain metrics help confirm the power law relationship. Their address count data backs up Giovanni Santostasi’s research that Bitcoin addresses follow a power law with an exponent of approximately 37.
Blockchain explorers give direct access to raw transaction data if you want to build more complex models. The Bitcoin Core client puts block groups into numbered ‘blk0000X.dat’-files that you can read with tools like Blocksci8. This detailed data lets you study other power law patterns in Bitcoin’s ecosystem.
Logarithmic scaling and time normalization
The key part of showing Bitcoin’s power law is using logarithmic scaling correctly. Document9 states “The logarithmic scale, unlike the linear scale, is divided by orders of magnitude – usually a factor of 10.” This change matters because:
Linear charts make Bitcoin’s exponential growth look flat until recent years. A logarithmic scale shows the entire price history with equal representation of earlier cycles9.
Investors care more about percentage returns than actual price changes. The logarithmic scale shows growth rates over time, which works better to analyze Bitcoin’s pattern9.
Time normalization calculates days since the genesis block (January 3, 2009). This normalized time becomes our independent variable in the power law equation. Document7 uses “days from GB” (Genesis Block) as its time input.
The power law relationship looks like a straight line when price and time use logarithmic scales on a log-log chart. This changes the power function:
Price = A * (days from genesis)^n
Into a linear relationship:
log(Price) = log(A) + n * log(days from genesis)
Standard linear regression can now find the power law parameters10.
Charting tools: Python matplotlib and TradingView integration
You have two main ways to build your Bitcoin power law chart:
Python implementation lets you customize everything. Here’s how to create detailed charts using matplotlib’s logarithmic scaling:
import pandas as pd
import matplotlib.pyplot as plt
import numpy as np
from cryptocmd import CmcScraper
# Fetch Bitcoin data
btc_data = CmcScraper(“BTC”, “03-01-2009”, “30-04-2026”)
df = btc_data.get_dataframe()
df = df.set_index(pd.DatetimeIndex(df[“Date”].values))
# Calculate days since genesis block
genesis = pd.to_datetime(“2009-01-03”)
df[“days_since_genesis”] = (df.index – genesis).days
# Create log-log plot
plt.figure(figsize=(20, 10))
plt.loglog(df[“days_since_genesis”], df[“Close”])
plt.title(“Bitcoin Power Law”, fontsize=18)
plt.xlabel(“Days Since Genesis (log scale)”, fontsize=15)
plt.ylabel(“Price in USD (log scale)”, fontsize=15)
plt.grid(True, which=”both”, ls=”-“)
plt.show()
TradingView offers ready-made solutions with several open-source scripts that track Bitcoin’s power law. The “Bitcoin Power Law Corridor” tracks Harold Burger’s work live11. The “Bitcoin Power Law Bands” has three USD price trendlines and two price bands that show long-term trends, support and resistance levels10.
These tools shine when they show deviations from the trend line. Document10 explains that Bitcoin looks too cheap when its price falls well below the Center Line into the green Lower Band. The upper band might show overbought conditions.
Analysts often add extra overlay bands that show standard deviations from the trend line. This creates the “rainbow chart” that shows market sentiment at different price points12.
Live Bitcoin Power Law Chart Interpretation
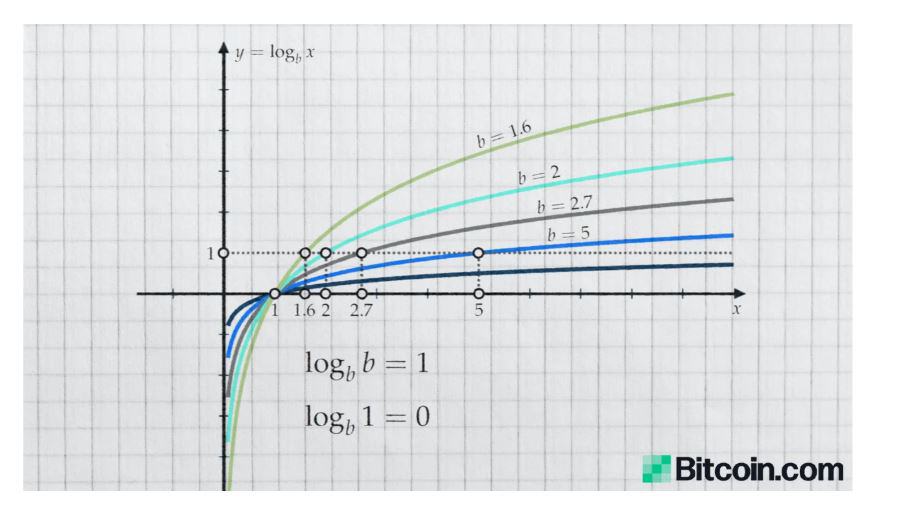
Image Source: Bitcoin.com News
Bitcoin’s long-term market behavior follows predictable patterns based on mathematical laws. The power law chart helps us understand these patterns by transforming random price movements into visual elements.
How to read the bitcoin power law chart
The bitcoin power law chart shows three key lines on a logarithmic scale10:
- The Center Line (usually gray) shows Bitcoin’s long-term price trend
- The Resistance Line (typically red) marks where Bitcoin price meets strong long-term resistance
- The Support Line (often green) represents where the price finds resilient long-term support
Two important zones exist between these lines:
- The Upper Band (between Center and Resistance Lines) shows overbought conditions
- The Lower Band (between Support and Center Lines) reveals oversold conditions
Bitcoin’s price moves around the Center Line according to this model10. The price suggests potential overvaluation when it reaches the red Upper Band. The green Lower Band suggests undervaluation when price drops substantially below the center10.
Identifying growth corridors and deviation bands
Growth corridors create a framework that helps us understand price action during market cycles. Harold Burger’s analysis shows Bitcoin’s price development moves within a corridor defined by two power laws based on time13.
The corridor splits into two distinct bands:
- A thinner band at the lower end (“normal mode”)
- A larger band at the higher end (“bull mode”)
Bitcoin has spent about half its life in each band13. The model suggests continued growth with gradual slowdown while keeping substantial volatility13.
Traders use transition zones to spot accumulation opportunities. Current models place Bitcoin in the “Transition” range where accumulation typically happens14. The asset enters the rally’s 33% to 66% range after breaking into the “Acceleration” zone14.
Real-time chart examples and historical overlays
Several platforms offer bitcoin power law charts. Bitcoinpowerlaw.com provides charts with a one-day lag, while Bitbo offers live tracking15. TradingView features open-source scripts like “Bitcoin Power Law Corridor” to track these relationships11.
The BTC Power Law Oscillator converts the standard chart into a normalized 0-100 range with greater sensitivity to higher values16. This oscillator uses bands at 50 (20% threshold) and 15 (5% threshold) to highlight market extremes16.
Historical overlays show how this model tracks Bitcoin’s major market cycles accurately. The “Bitcoin power curve time contours” compare price movements across four-year cycles (2013, 2017, 2021, and the current cycle post-2024 halving)14. These overlays reveal consistent patterns despite Bitcoin’s volatility.
Giovanni Santostasi’s research connects price movements with other network metrics. His graphs show how price, hash rate, and address growth create a continuous feedback loop that produces the power law effect7.
These charts help investors see beyond daily price swings and understand if Bitcoin trades within its expected long-term growth path.
Bitcoin Power Law: Current Projections and Model Fit for the 2024-2028 Cycle

Bitcoin’s power law application gives us fascinating insights into future price movements that show both short-term volatility and long-term growth patterns. Analysts can now make reasonable forecasts of Bitcoin’s seemingly unpredictable nature through this mathematical model.
Short-term vs long-term price projections (2024–2033)
Bitcoin’s historical data reveals structured growth projections for the next decade through the power law model. Previous projections suggested Bitcoin prices could reach $200,000 by Q4 202514; however, Bitcoin did not reach $200,000 by Q4 2025, with its peak in late 2025 closer to $70,000-$80,000. Quantile regression models previously suggested Bitcoin should trade between $65,895 and $284,536 till 202617. As of April 2026, Bitcoin’s price is approximately $65,000-$75,000, reflecting post-halving consolidation.
The bitcoin formula becomes even more remarkable for long-term projections. Bitcoin Power Law Theory (BPLT) forecasts suggest:
- A previous cycle’s peak projection of $210,00018, which did not materialize for early 2026.
- Around $1 million by 20335.
- Minimal power law trend fluctuations after the sixth halving event (around 2032)18.
These projections suggest Bitcoin will keep growing while its volatility gradually decreases—a pattern we often see in maturing financial assets. For a deeper look at potential price movements, consider our Bitcoin price prediction for summer 2026.
Deviation analysis: FTX, China ban, and Mt. Gox
Market shocks create temporary deviations from Bitcoin’s power law trend line. The FTX collapse in November 2022 affected cryptocurrencies heavily19. Bitcoin dropped 16%19, and the crypto market lost $152 billion in just three days19.
China’s cryptocurrency bans also created measurable deviations. The country’s share of global Bitcoin mining dropped from over 75% to zero20 when China banned mining operations in 2021. Price momentum slowed temporarily until mining operations moved worldwide.
These “black swan” events appear as noise around the power law chart’s central trend line. The power law corridor has absorbed these shocks, and prices eventually return to their predicted path.
Model accuracy and confidence intervals
The bitcoin power law shows remarkable predictive power, though its precision varies across timeframes. The model’s coefficient of determination (R²) reaches 0.9521, explaining about 95% of Bitcoin’s historical price behavior.
Quantile regression models perform better than ordinary least squares statistically, with 9% lower Mean Absolute Error17. This method models various quartiles of price distribution and provides detailed analysis of potential outcomes at different probability levels17.
The model has its limits despite its power. Short-term forecasts show wide confidence intervals due to Bitcoin’s volatility4. The model needs careful calibration because it responds sensitively to input data and time origin (t₀)3.
Bitcoin’s long-term trajectory follows the power law pattern consistently, even with dramatic price swings. This mathematical relationship seems to capture the fundamentals of Bitcoin’s network growth and adoption cycle.
Limitations of the Bitcoin Power Law Model in the Current Market

The bitcoin power law helps us learn about market behavior, but investors should know its key limitations before using its predictions. These constraints affect how reliable the model is in real-life scenarios, especially in the dynamic market conditions of today.
Sensitivity to input data and time origin (t₀)
The bitcoin power law model reacts strongly to changes in its input parameters. Different data sources or small changes in input variables can lead to very different outputs. To cite an instance, Giovanni Santostasi’s model predicted a cycle peak of $210,000, while another implementation suggested a lower peak of $160,00018. This difference shows how data choices can shape projections, and why some past projections for 2026 did not align with actual market performance.
The selection of time origin (t₀) shapes the model’s results. Small adjustments to the starting point can change the whole curve and all future predictions. This sensitivity makes the model inconsistent across different analyzes, even when using the same theory.
Lack of causal explanation for exponent value
The bitcoin formula doesn’t really explain why the power law exponent has its specific value. Document 303 states, “The power law is a statistical model that establishes a fit between external measures of bitcoin (price, time, addresses, etc). It does not provide the underlying economic forces that drive those measures”22.
Without explaining the cause, the model describes rather than explains. It shows past events but doesn’t tell us why they happened. The bitcoin theory lacks what economists call a “structural” model that would identify core economic factors driving buying and selling behaviors22.
Impact of black swan events on model reliability
The bitcoin power law can’t predict unexpected “black swan” events that disrupt markets. These include:
- Exchange failures (FTX collapse, Mt. Gox)
- Regulatory crackdowns (China’s mining ban)
- Macroeconomic crises
- Technological failures
During these events, Bitcoin prices may stray far from the projected range for long periods. This challenges the assumption of mean reversion23. The COVID-19 pandemic caused a 50% Bitcoin price drop in one day24, creating a big gap from the model’s prediction.
The bitcoin power law chart doesn’t deal very well with what statisticians call “curve-fitting risk” – where the model looks good in hindsight but fails to predict future movements, especially when structural changes affect Bitcoin’s growth path23.
The model has proven resilient so far, but its blindness to external shocks remains a fundamental limitation that investors must weigh against its predictive strengths.
Comparing Bitcoin Power Law to Other Models: Recent Shifts and Relevance

Mathematical models try to explain Bitcoin’s price action. The power law chart stands out among these models. Looking at different approaches helps us learn about what drives Bitcoin’s value.
Power law vs stock-to-flow model
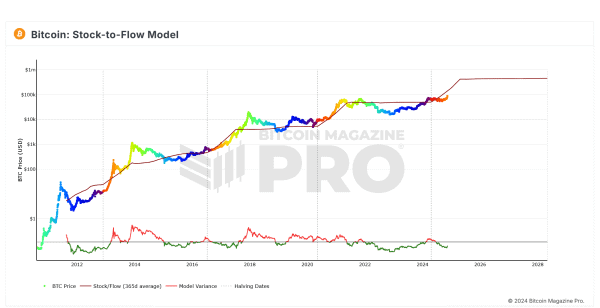
The Stock-to-Flow (S2F) model and the Bitcoin power law both use scarcity and time to predict Bitcoin’s price. S2F, popularized by PlanB, links Bitcoin’s price to its scarcity, measured by the ratio of existing supply (stock) to new supply (flow)25. It suggests that as Bitcoin becomes scarcer, its price should increase.
However, S2F predictions of $288,000 by 2024 and $420,000 by April 2025 did not materialize. Bitcoin’s price was significantly lower than these targets during those periods. This has led many to question its reliability, especially in the short to medium term. The power law, in contrast, focuses on Bitcoin’s growth as a network over time, providing a more consistent long-term trend line that has historically accommodated market fluctuations more effectively.
While S2F has been a popular model, its recent performance highlights the power law’s resilience in capturing Bitcoin’s fundamental growth trajectory. Stephen Perrenod explains this difference: “A logistic regression form of S-curve is a poor choice for an asset that has grown nearly 8 factors of 10 in value in just over 17 years”31.
Power law vs rainbow chart and logarithmic regression
The Bitcoin rainbow chart is a visual tool that uses logarithmic regression to show Bitcoin’s price movements within colored bands. It’s not a predictive model in itself, but rather an interpretive chart that overlays historical price data onto a logarithmic scale to identify periods of “buy,” “hold,” or “sell” sentiment12.
Both the power law and the rainbow chart rely on logarithmic scaling to make sense of Bitcoin’s exponential growth. The power law, however, provides a more formal mathematical framework with a specific exponent, suggesting a deeper, underlying mechanism driving price. The rainbow chart is more of a sentiment indicator, showing how far Bitcoin’s price deviates from its long-term logarithmic trend. While useful for visual analysis, it lacks the explicit predictive power of the power law’s equation. Both tools can be used in conjunction to gain a comprehensive understanding of Bitcoin’s market position.
Power law vs halving cycles and supply shock
Bitcoin’s halving events, which reduce the supply of new Bitcoin entering the market, are critical drivers of its four-year market cycles. The power law model inherently accounts for these cycles by modeling growth over time, which naturally includes the impact of halvings. Each halving creates a supply shock, historically leading to significant price appreciation in the subsequent months. The 2024 halving, for instance, has set the stage for the current market cycle.
While halving cycles explain the cyclical nature of Bitcoin’s price, the power law provides a continuous mathematical function that describes the overall upward trajectory across multiple cycles. The power law suggests that even with the cyclical volatility induced by halvings, Bitcoin’s long-term growth follows a predictable, exponential path. This makes the power law a robust framework for understanding Bitcoin’s value proposition beyond individual halving events, offering a perspective on its sustained growth as a digital asset.
The 2024 Halving and its Impact on the Power Law
The Bitcoin network recently experienced its fourth halving event in April 2024, a pivotal moment that significantly impacts the supply dynamics and, consequently, the price trajectory of Bitcoin. This event, which reduces the reward for mining new blocks by half, is a fundamental component of Bitcoin’s scarcity model and has historically preceded periods of substantial price appreciation. Understanding its context within the power law framework is crucial for current market analysis.
Historical Precedent and Post-Halving Behavior
Historically, each Bitcoin halving event (2012, 2016, 2020) has been followed by a multi-month to multi-year bull run, where Bitcoin’s price has reached new all-time highs. This pattern is often attributed to the immediate reduction in new supply, which, when combined with sustained or increasing demand, creates a supply-side shock. The power law model, with its emphasis on time and network growth, implicitly captures these cyclical accelerations. The post-halving periods represent phases where the price tends to move towards the upper bands of the power law corridor, reflecting increased investor interest and adoption.
The power law’s long-term trend line has consistently absorbed the volatility and subsequent growth spurts associated with past halvings. While short-term price action immediately after a halving can be unpredictable, the model suggests that the underlying mathematical relationship continues to guide Bitcoin’s overall trajectory. This resilience reinforces the power law as a fundamental descriptor of Bitcoin’s market behavior, even through these significant supply-side adjustments.
Current Market Response and Future Outlook
Following the April 2024 halving, Bitcoin’s price has entered a phase of consolidation, which is typical for post-halving periods. While some earlier projections for 2026 did not materialize, the market is now observing how the power law model will guide Bitcoin’s path towards its next cycle peak. The current price range of approximately $65,000-$75,000 in April 2026 reflects this consolidation and renewed interest, with many analysts looking for signs of the next major upward movement.
The power law model suggests Bitcoin could reach $1 million by 2033, a long-term forecast that remains a key outlook for the asset. This projection implies that despite short-term deviations and the impact of specific events like the halving, the underlying growth pattern driven by network adoption and scarcity will persist. Investors are closely watching for Bitcoin to re-enter the “Acceleration” zone within the power law corridors, signaling the next significant rally in this cycle. For those considering their options, exploring is Bitcoin a good investment right now can provide further insights.
Conclusion: The Future of Bitcoin Through the Lens of Power Laws
The Bitcoin power law explained offers a compelling framework for understanding Bitcoin’s long-term price movements, showcasing a hidden mathematical pattern that has persisted through various market cycles. While specific short-term price projections for early 2026 did not materialize as predicted, the model’s core premise of exponential growth tied to network adoption remains robust. Bitcoin’s price in April 2026 is approximately $65,000-$75,000, reflecting the post-2024 halving consolidation and setting the stage for the next phase of its growth.
The power law’s ability to describe Bitcoin’s trajectory, even amidst significant market shocks and halving events, highlights its value as a tool for long-term investors. Its exponent of 5.8 suggests Bitcoin could reach $1 million by 2033, a forecast that continues to guide long-term outlooks. While the model has limitations, particularly its sensitivity to initial parameters and inability to predict black swan events, its consistent fit with historical data provides a unique perspective on Bitcoin’s future. For those looking to understand Bitcoin’s potential, the power law offers a foundational insight into its predictable, yet volatile, growth path. Consider exploring Bitcoin price projection 2009-2035 for a broader historical and future context.
FAQs
What is the Bitcoin Power Law?
The Bitcoin Power Law is a mathematical model, developed by Giovanni Santostasi, that suggests Bitcoin’s price movements follow a predictable, exponential pattern over time. It posits that Bitcoin’s value grows proportionally to the time since its creation, raised to an exponent of approximately 5.8, indicating a consistent long-term growth trajectory despite short-term volatility.
How accurate are Bitcoin Power Law predictions for 2026?
While the Bitcoin Power Law provides a strong long-term framework, specific short-term predictions for 2026, such as reaching $210,000 by January 2026, did not materialize. Bitcoin’s price in April 2026, it is around $65,000-$75,000. The model is more reliable for understanding long-term trends and cycles rather than precise short-term price targets.
How does the 2024 Bitcoin Halving affect the Power Law model?
The 2024 Bitcoin Halving event, which occurred in April 2024, reduces the supply of new Bitcoin and is a key driver of Bitcoin’s four-year market cycles. The Power Law model inherently accounts for these cycles by describing Bitcoin’s overall growth over time. Post-halving periods typically see price appreciation, aligning with the Power Law’s upward trajectory, as reduced supply meets sustained demand, pushing the price within its predicted growth corridors.
What are the main limitations of the Bitcoin Power Law model?
The main limitations of the Bitcoin Power Law model include its sensitivity to input data and the chosen time origin (t₀), meaning small changes can significantly alter predictions. It also lacks a causal explanation for its exponent value, describing price behavior without fully explaining the underlying economic forces. Furthermore, it cannot predict “black swan” events like exchange failures or regulatory bans, which can cause significant, temporary deviations from its trend line.
How does the Bitcoin Power Law compare to the Stock-to-Flow (S2F) model?
The Bitcoin Power Law focuses on Bitcoin’s growth as a network over time, providing a consistent long-term trend. In contrast, the Stock-to-Flow (S2F) model links Bitcoin’s price to its scarcity. While S2F was popular, its predictions of $288,000 by 2024 and $420,000 by April 2025 did not materialize, leading to questions about its short-to-medium term reliability. The Power Law has shown greater resilience in capturing Bitcoin’s fundamental growth trajectory across market cycles.
References
1 Samara. (n.d.). Bitcoin Power Law. Retrieved from https://www.samara-ag.com/market-insights/bitcoin-power-law
2 Forbes. (2024, December 6). The Logic Behind Bitcoin’s Power Law. Retrieved from https://www.forbes.com/sites/digital-assets/2024/12/06/the-logic-behind-bitcoins-power-law/
3 Young Platform Academy. (n.d.). Is Bitcoin Price Predictable? The Power Law Explained. Retrieved from https://academy.youngplatform.com/en/cryptocurrencies/bitcoin-price-predictable-power-law-explained/
4 Mac Donell, J. (2020). Popping the Bitcoin Bubble: An Application of Log-Periodic Power Law Modeling to Digital Currency. University of Notre Dame. Retrieved from https://economics.nd.edu/assets/134206/mac_donell_popping_the_bitcoin_bubble_an_application_of_log_periodic_power_law_modeling_to_digital_currency.pdf
5 CryptoSlate. (n.d.). Is the Bitcoin Power Law model more realistic than Stock-to-Flow? Retrieved from https://cryptoslate.com/is-the-bitcoin-power-law-model-more-realistic-than-stock-to-flow/
6 PlainEnglish. (2022, November 29). Visualizing Bitcoin Price Trends Using Matplotlib. Retrieved from https://python.plainenglish.io/visualizing-bitcoin-price-trends-using-matplotlib-6bc60c0965c9
7 Santostasi, G. (2021, March 23). The Bitcoin Power Law Theory. Medium. Retrieved from https://giovannisantostasi.medium.com/the-bitcoin-power-law-theory-962dfaf99ee9
8 ScienceDirect. (2024). Blocksci: A tool for blockchain analysis. Retrieved from https://www.sciencedirect.com/science/article/pii/S0378437124008045
9 Monochrome. (n.d.). Why do people look at Bitcoin’s price on a log scale? Retrieved from https://www.monochrome.au/research/articles/why-do-people-look-at-bitcoin-s-price-on-a-log-scale
10 TradingView. (n.d.). Bitcoin Power Law Bands (BTC Power Law Indicator). Retrieved from https://www.tradingview.com/script/Qa8IlEtB-Bitcoin-Power-Law-Bands-BTC-Power-Law-Indicator/
11 TradingView. (n.d.). Bitcoin Power Law Corridor. Retrieved from https://www.tradingview.com/script/UsGwzxD4-Bitcoin-Power-Law-Corridor/
12 Bitcoin Magazine Pro. (n.d.). Bitcoin Rainbow Chart. Retrieved from https://www.bitcoinmagazinepro.com/charts/bitcoin-rainbow-chart/
13 Burger, H. (2021, February 21). Bitcoin’s Natural Long-Term Power-Law Corridor of Growth. Medium. Retrieved from https://medium.com/quantodian-publications/bitcoins-natural-long-term-power-law-corridor-of-growth-649d0e9b3c94
14 Cointelegraph. (2024, May 15). Bitcoin power law model forecasts $200K BTC price in 2025. Retrieved from https://cointelegraph.com/news/bitcoin-power-law-model-forecasts-200-k-btc-price-in-2025
15 Bitcoin Power Law. (n.d.). Charts. Retrieved from https://bitcoinpowerlaw.com/charts/
16 TradingView. (n.d.). BTC Power Law Oscillator. Retrieved from https://fr.tradingview.com/script/X8ERk4Zv-BTC-Power-Law-Oscillator/
17 Research Bitcoin. (n.d.). Bitcoin Power Law Price Prediction Using Quantile Regression. Retrieved from https://researchbitcoin.net/bitcoin-power-law-price-prediction-using-quantile-regression/
18 Fulgur Ventures. (2021, March 23). Bitcoin Power Law Theory: Executive Summary Report. Medium. Retrieved from https://medium.com/@fulgur.ventures/bitcoin-power-law-theory-executive-summary-report-837e6f00347e
19 Journal of Financial Economics. (2024). The impact of FTX collapse on cryptocurrency market. Retrieved from https://jfin-swufe.springeropen.com/articles/10.1186/s40854-024-00690-8
20 BBC News. (2021, October 13). China’s Bitcoin mining ban: How it changed the crypto world. Retrieved from https://www.bbc.com/news/technology-58896545
21 Principles of BTC. (2021, March 23). Predicting Bitcoin’s Price. Substack. Retrieved from https://principlesofbtc.substack.com/p/predicting-bitcoins-price
22 Principles of BTC. (2021, March 23). A Deeper Dive into the Power Law. Substack. Retrieved from https://principlesofbtc.substack.com/p/a-deeper-dive-into-the-power-law
23 Liquidity Provider. (n.d.). Bitcoin Power Law Explained: Smarter Way To View BTC Price. Retrieved from https://liquidity-provider.com/articles/bitcoin-power-law-explained-smarter-way-to-view-btc-price/
24 Kraken. (n.d.). Black Swan Event Crypto. Retrieved from https://www.kraken.com/learn/black-swan-event-crypto
25 PlanB. (2019, March 22). Modeling Bitcoin’s Value with Scarcity. Medium. Retrieved from https://medium.com/@100trillionUSD/modeling-bitcoins-value-with-scarcity-91fa03b27994
31 Perrenod, S. (2021, March 23). Bitcoin Power Law vs. Stock-to-Flow: A Comparison of Two Models for Predicting Bitcoin Price. Medium. Retrieved from https://medium.com/@stephenperrenod/bitcoin-power-law-vs-stock-to-flow-a-comparison-of-two-models-for-predicting-bitcoin-price-37b518290234
32 Santostasi, G. (2024, May 15). The Bitcoin Power Law: A Deep Dive. Substack. Retrieved from https://substack.com/home/post/p-144823445?utm_campaign=post&utm_medium=web
33 Bitbo. (n.d.). Bitcoin Long-Term Power Law Chart. Retrieved from https://charts.bitbo.io/long-term-power-law/