

What is MetaTrader 4?
MetaTrader 4 is a powerful trading platform primarily designed for trading Forex. Many brokers currently support MetaTrader 4, and some also support Expert Advisors, which allow you to utilize automated trading strategies created by other traders. MT4 also comes with an API for both traders and brokers, facilitating custom integrations and advanced functionalities.
MT4 offers native client support for Android, iOS, and Windows. For macOS and Linux users, the client operation has been significantly optimized under WINE, and an updated DMG package is readily available for easier installation on macOS computers. Web Trading is also supported, providing flexibility across devices. While MetaTrader 5 is now available and has surpassed MT4 in overall trading volume, MetaTrader 4 remains a strong choice, especially for forex-focused traders and those who rely on its extensive ecosystem of MQL4 Expert Advisors and indicators.
A comparison of MetaTrader 4 vs 5 will be presented below. What is MetaTrader 4 exactly and how do we use it? Let’s take a look.
Installation of MT4
The installation of MetaTrader 4 is not much unlike installing any other software, so we will focus on actually using the software once installed.
The actual install process may vary slightly depending upon your platform, but generally desktop users will need to agree with the terms and conditions and choose a directory location for the program to be installed.
It is recommended to stick with the default location to ensure all components are correctly placed. The installation wizard or app store will guide you through the required steps needed to get up and running. Before starting, always check the minimum system requirements to ensure a smooth installation and optimal performance.
Getting Around: How to Use MetaTrader 4
Once installed, start MetaTrader 4 and you will notice that there are a lot of options. Let’s look around and take a brief survey of the menus and options that are available.
When you first open up the application and start learning how to use MetaTrader 4, you typically see a candlestick chart on the right side of the screen and a Market Watch pane on the left side, with a Navigator pane showing a tree structure of your account, indicators, expert advisors and scripts underneath the Market Watch pane.
The Market Watch pane consists of a Symbols tab and a Tick Chart tab. The Symbols tab gives you a summary of all the available currency pairs and their current bid and ask prices. You can right click on each the currencies and get a sub-menu that offers a lot of options. For instance, you can customize which columns are visible in the Symbols tab, adding or removing details like ‘Spread’ or ‘High-Low’ to tailor the view to your trading preferences.
If you choose Tick Chart on the sub-menu, the Tick Chart will become activated and be filled with a ticket chart of that currency pair. Other useful options in the sub-menu include:
- Depth of Market is a screen that allows you to more quickly and easily set stop and limit orders at particular price levels. This feature provides a real-time view of market liquidity and order book depth, helping traders identify potential support and resistance zones.
- The Specification option shows you a lot of detail about the currency pair, including the spread type, number of digits the currency pair carries, contract size, margin currency, margin percentage, minimal and maximal volumes, swap type, long and short swap in pips and session times when the currency pair can be quoted or traded.
- Spread, High-Low, Time have spaces in front of them on the submenu for checkboxes, which allows you to add these columns to the table on the Symbols tab.
At the bottom of the screen is the Terminal pane. This contains a lot of information—there are 11 tabs at the bottom of this pane.
The tabs are Trade, Exposure, Account History, News, Alerts, Mailbox, Company, Market, Code Base, Experts and Journal. The ‘Company’ tab, for example, often provides quick access to your broker’s website or support resources, making it convenient to find essential information without leaving the platform.
- The Trade pane shows you the status of open positions and pending orders. You can also see your Balance, Equity, Margin, Free margin and Margin level. From this tab you can open new positions, modify existing positions or close existing positions. Monitoring your ‘Free margin’ is crucial, as it indicates the amount of capital available for opening new positions or absorbing losses before a margin call might occur.
- The Exposure tab shows you a very useful graph showing your exposure. If you were 2 lots long AUD/USD and 2 lots short EUR/USD, your Exposure might look like this.

- Your Account history shows you all your closed positions. You can see the resulting profit/loss, credit, deposit and withdrawal amounts. This tab is invaluable for reviewing past performance and identifying patterns in your trading strategy.
- The News tab fills you in on Forex news events. Key data releases, central bank decisions and economic news are presented in this pane. For example, you might see announcements regarding interest rate decisions from major central banks or inflation reports, which can significantly impact currency movements.
- The Alerts tab allows you to create, modify and delete alerts. You could set an alert to let you know when the bid price for AUD/USD dips below 0.75216 for example. You can also disable all alerts here.
- The Mailbox tab will show you messages from your broker. Perhaps you will receive a Welcome message here if you’ve just signed up or they may send you a message about their Expert Advisors.
- The Company tab displays a page that your broker considers useful to you, like their main website or perhaps a technical support page. The broker can also decide to remove this tab so you may not see it at all.
- The Market tab is a store for MQL4 code where you can download trading robots, additional indicators not natively provided by MT4 and various other applications. This marketplace is a part of the broader MQL5.community, offering a vast array of tools to enhance your trading experience.
- The Code Base tab provides you a way to download parts of the code base available at MQL4.community. These include things like expert advisors, indicators and scripts.
- The Experts tab gives you all the information about the attached expert—opened and closed positions, modified orders and the direct messages from the expert itself.
- The Journal tab contains the activity of the trader in the current session—essentially a lot of the trading activity since the client was opened.


How to Use MetaTrader 4 to Make a Trade
MT4 has a pretty formidable interface for someone not familiar with it. So the first thing you might be wondering when you start learning how to use MetaTrader 4 is how you make a trade.
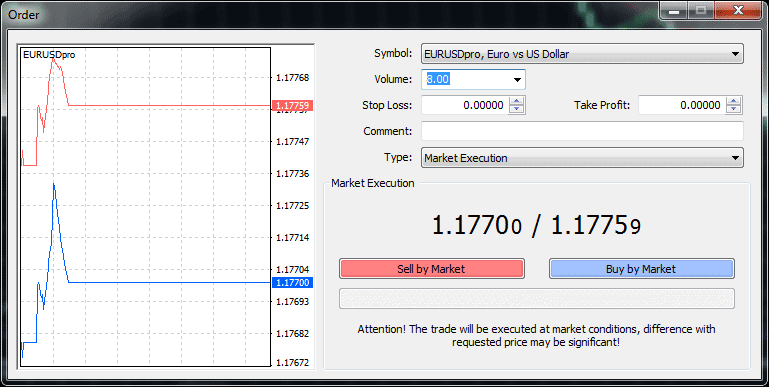
On the toolbar at the top is a “New Order” button. When you click this, you will be prompted with a dialog box like the one below. You would choose the amount of Lots to be traded beside where it says “Volume:”
Then you would simple click sell or buy based on whatever price is shown right above the buy and sell buttons. Always practice placing trades on a demo account first to familiarize yourself with the process and avoid risking real capital while learning.
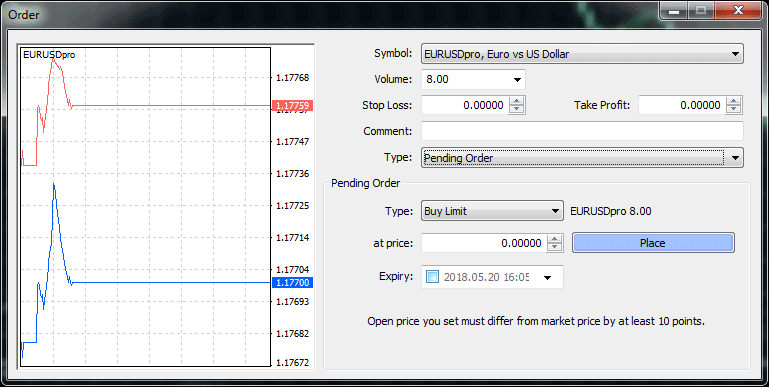
When you change the selection in the Type drop down, signifying the order type, to Pending Order, your dialog box will look like that shown below.
This allows you to set specify limit and stop orders. The Comment field allows you to enter notes about the trade for your own use later.
A Limit order is placed above (sell limit) or below (buy limit) the currency market prices. For example if the Eur/Usd is trading at 1.1770 / 1.1775. you would be able to place a buy or sell limit order that would trigger when the price hits that limit order price you put in. A ‘Buy Limit’ order is placed below the current market price, aiming to buy when the price drops to a more favorable level, while a ‘Sell Limit’ order is placed above the current market price, aiming to sell when the price rises.
You can open a new chart using the toolbar button above or by navigating the menu File > New Chart. Either way, you will be shown a popup menu to select the currency you want to chart.
These buttons, located about halfway down the toolbar allow you to specify bars, candlesticks or line for your chart type.
These buttons to the immediate right of the chart type buttons allow you to zoom in and out of the chart.
This button allows you to add indicators to your chart. This includes both indicators that require their own pane, such as Moving Average Convergence/Divergence (MACD) and Relative Strength Index (RSI), and ones that overlay such as Bollinger Bands or the Parabolic SAR. To apply an indicator, simply click this button, select your desired indicator from the list, and then adjust its parameters in the pop-up window before clicking ‘OK’.
This button is for specifying the period of the chart. The options are the standard periods used in Forex charting: 1 Minute, 5 Minutes, 15 Minutes, 30 Minutes, 1 Hour, 4 Hours, Daily, Weekly and Monthly.
Analytics in MT4
MT4 allows you to draw lines, shapes, arrows and text on your charts. This allows you to more easily mark patterns that you may be interested in on these charts.
- Horizontal lines can be used to identify a particular price level. They are especially useful for marking support and resistance.
- Vertical lines are generally used to mark the variable increasing along the x-axis, which is time. If you want to mark the time of a certain event, like perhaps a news event, you would mark a vertical line at the corresponding time on the chart.
- Trendlines allow you to draw a line between any two points on the field of the chart. This is generally done to identify trends. These trendlines tend to be diagonal lines—going from the lower left to the upper right for uptrends and from the upper left to the lower right for downtrends.
- Trendline by angle lets you draw a trendline by specifying an initial point and an angle.
- A linear regression channel enables you to use linear regression to forecast where the price will be in a trend at a certain point, assuming it continues in the same fashion.
- Equidistant channel lets you draw a channel composed of two parallel lines by only specifying one of them.
- Standard Deviation channel uses standard deviation to measure the volatility in a market.
- Gann line is a trendline drawn with a 45-degree angle.
- Gann Fan allows you to set one point and then a ray of 1×1 is imposed on the chart. This ray corresponds to a Gann line. Lines of other angles are imposed on the chart and if price goes above the 1×1 ray, the market is considered bullish, but if it falls below the 1×1 ray, the market is to be considered bearish.
- Andrew’s Pitchfork takes three points and draws parallel trendlines. These are interpreted as support and resistance.
- Other analytics include the Gann Grid and Cycle Lines.
The Fibonacci tools are based on Fibonacci numbers, which were developed by Leonardo Fibonacci. Each number in the series is the sum of the previous two numbers.
- Fibonacci Retracement/Join – this tool is used by specifying two points representing a trend and the 0.0%, 23.6%, 38.2%, 50%, 61.8, 100%, 161.8%, 261.8% and 423.6% Fibonacci levels are imposed over the trendline. Traders often use the 38.2%, 50%, and 61.8% retracement levels as potential areas where price might reverse before continuing its original trend.
- Fibonacci Channel is specified by the width of a channel. This width is given a width of one unit to arrive at the distances of 0.618, 1.000, 1.618, 2.618 and 4.236.
- Fibonacci Time Zones use Fibonacci sequences and applying them to time. Fibonacci Fan and Fibonacci Arcs apply the Fibonacci sequences to a fan and arc respectively.
Expert Advisors and Auto Trading Features
Expert Advisors are MQL4 programs that automate trading strategies and processes. They can be created using the built-in MetaEditor, a powerful integrated development environment.
You activate an Expert Advisor by adding it to a chart and you disable an Expert Advisor by removing it from the chart. Many traders find Expert Advisors on the MQL5.community marketplace, where a wide variety of free and paid options are available.
Signals
Signals are a way to take advantage of the strategies of successful traders by activating them and adding them right into your own account.
You need a MQL5 community account to be able to use signals. Some signals are free, while others require you to pay a fee.
Once you subscribe to a signal provider’s signal, the copying of trading operations happens automatically, and all their trading actions will be performed on your account. They don’t even need to have an account on the same brokerage. However, always perform thorough due diligence on signal providers, checking their historical performance and risk metrics before subscribing.
Virtual Hosting Features
When you need continuous access between your client and the trading servers, you need virtual hosting.
This can be very useful if you have purchased an Expert Advisor, have subscribed to a signal or if you have some other kind of automated trading, like a trading robot.
There is a cost involved, but you will be able to register with the server closest to your broker and easily migrate the necessary data to it for reliable, always-on performance. This ensures your automated strategies run without interruption, even if your local computer is turned off or loses internet connection.
MQL4
Trading strategies built in the client terminal are coded in MQL4. This is the language that MT4’s expert advisors are written.
MQL4 can also be utilized to write custom indicators as well as scripts that automate trading activities.
Programming MQL4 is probably not something to attempt for someone just getting started and learning how to use MetaTrader 4, but it is there if you have programming experience and if you are eager to add some level of automation to your trading. For those with coding skills, MQL4 offers extensive capabilities for developing complex trading systems and backtesting them against historical data.
Here is another differentiation in the MetaTrader 4 vs 5 argument, but for other reasons that we will soon cover, not a typical reason for choosing MetaTrader 5. Custom indicators written in MQL4 are not compatible with MetaTrader 5, so this is another consideration in the debate of MetaTrader 4 vs 5.
MetaTrader 4 vs 5
It is a common misconception that MetaTrader 5 is a newer and more improved version of MetaTrader 4. This is not exactly true. While MetaTrader 5 has indeed surpassed MetaTrader 4 in trading volume as of early 2025, accounting for 54.2% of the combined volume, and receives new feature development, MT4 continues to be maintained with security updates and bug fixes.
What is MetaTrader 4 good at that MetaTrader 5 wouldn’t be an improvement on?
While MetaTrader 4 was designed exclusively for trading the Forex market, MetaTrader 5 was designed to meet the demands of the stocks and commodities markets, and to comply with regulations binding against U.S.-based Forex brokers.
Thus, questions of MetaTrader 4 vs 5 really don’t have a lot of merit for many traders. U.S.-based Forex brokers must handle buys and sells from a client on a F.I.F.O. basis, that is, a first-in, first-out basis. MetaTrader 5 is designed to comply with this.
So, if you bought a lot of AUD/USD, and then bought another, MT5 does not allow you to manage these positions separately. Clients of brokers in other parts of the world, who do not have the burden of this requirement, have nothing to gain from such functionality.
For this reason, many traders are not excited about MT5 and have no intention of switching to it, especially those who prefer the simplicity and established MQL4 ecosystem of MT4. What is MetaTrader 4 but a tool to help you trade most effectively without worrying about regulations that don’t apply to you?
Conclusion
What is MetaTrader 4? It can be a daunting piece of software if you’re not familiar with it. But once you gain a level of familiarity with it, its power becomes evident and quickly overcomes any resistance to put forth the effort of learning it.
Expert Advisors and Signals offer powerful options even for those who don’t have or even want to form their own strategies and allow you to bring a wealth of trading knowledge in an automated form to your own account.
The question of MetaTrader 4 vs 5 is one that comes up often in Forex circles. While MetaTrader 5 has gained significant traction, MetaTrader 4 remains a robust and popular choice, particularly for forex traders outside of the U.S. who value its dedicated design and extensive MQL4 community. Its continued maintenance with security updates ensures its reliability for traders globally.
The best way to learn the Metatrader platform is to open a DEMO trading account with one of the brokers listed below.