Covered call ETFs have emerged as the hottest investment vehicle that income-seeking investors love, especially since the 2022 bear market . The Federal Reserve will likely make its first 25 basis point cut in September 2025 , and with interest rate cuts on the horizon, you should think over these income-generating powerhouses to add to your portfolio.
Several covered call ETFs have shown remarkable performance lately. The NEOS S&P 500 High Income ETF (SPYI) boasts an impressive 12.15% distribution rate as of June 30, 2025 and has attracted $1.77 billion in new investments year-to-date . JPMorgan Equity Premium Income ETF (JEPI) has delivered strong risk-adjusted returns through a portfolio of defensive, low-volatility U.S. equities .
Table of Contents
These funds shine especially when you have standard ETFs that focus on growth. Covered call ETFs generate regular income through option-writing strategies. The Amplify CWP Enhanced Dividend Income ETF (DIVO) has earned a prestigious 5-star Morningstar rating , which shows the quality potential of these investments.
This piece will get into the 11 best covered call ETFs that provide monthly income in 2026. We’ll help you discover the perfect additions from S&P 500 replicators to Nasdaq-focused funds and specialty offerings. These additions will create a well-laid-out portfolio that balances income potential with long-term growth opportunities .
JPMorgan Equity Premium Income ETF (JEPI)
 Image Source: MiFsee
The JPMorgan Equity Premium Income ETF (JEPI) leads the pack of covered call ETFs. With $33 billion in assets under management, it ranks as the largest actively managed ETF [1]. Since its launch in May 2020, income-focused investors have flocked to this fund. They value its monthly distributions and lower market volatility.
JEPI Key Features
JEPI creates income in a distinctive way through:
A defensive equity portfolio focused on quality U.S. large-cap stocks
An options overlay strategy using out-of-the-money S&P 500 Index call options
Monthly distributable income without exposure to duration or credit risk [2]
Target returns of 6-10% annually with approximately 35% lower volatility than the S&P 500 [3]
Risk-conscious investors find JEPI attractive because it delivers much of the S&P 500’s returns with less volatility [2]. The fund has showed its defensive strength during major market downturns [4].
JEPI Income Strategy
JEPI’s income comes from two sources. The fund builds a diversified portfolio of U.S. large-cap stocks with favorable risk/return characteristics. It also sells monthly call options on the S&P 500 Index through equity-linked notes (ELNs) [3].
The fund managed to keep an impressive yield that spiked to 8% recently, higher than its typical 6.89% three-year average [2]. JEPI’s 30-day SEC yield stands at 8.62% as of July 2025, with a 12-month rolling dividend yield of 8.13% [2]. This yield is a big deal as it means that it outperforms traditional dividend ETFs.
JEPI Tax Efficiency
JEPI’s high yield comes with tax implications you should think over. The fund’s use of equity-linked notes for its covered call strategy creates net investment income taxed at ordinary income rates [2]. This is different from other ETFs that rely more on return-of-capital distributions, which can help defer taxes.
JEPI Expense Ratio
At 0.35%, JEPI’s expense ratio competes well for an actively managed ETF [2]. The fee sits lower than 92% of ETFs in the derivative income category [5]. This offers excellent value given its active management and sophisticated options strategy.
JEPI Best Use Case
Risk-averse investors looking for these benefits will find JEPI ideal:
Consistent monthly income in a low-yield environment
Reduced portfolio volatility
Equity market participation with downside protection [3]
The fund works best in tax-advantaged accounts like IRAs where ordinary income tax impact matters less. It also diversifies income streams effectively by generating yield without bond duration risk or high-yield fixed income credit risk [2].
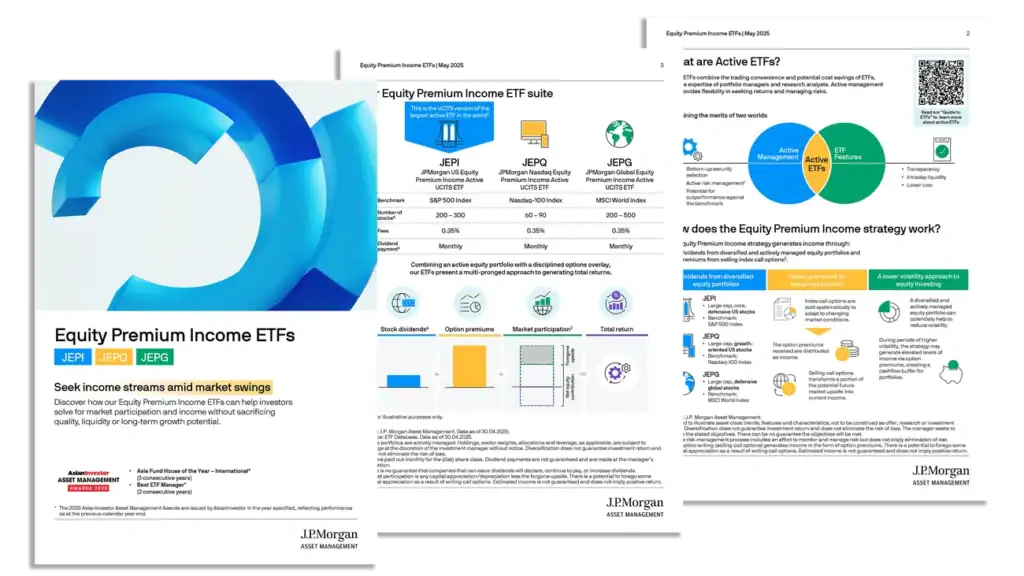
JPMorgan Nasdaq Equity Premium Income ETF (JEPQ)
Image Source: JP Morgan Asset Management
JPMorgan launched its tech-focused counterpart – the JPMorgan Nasdaq Equity Premium Income ETF (JEPQ) after JEPI’s soaring win. The ETF has grown to over $24 billion in assets since its 2022 launch [6]. It ranks among the most sought-after covered call ETFs that give investors both tech exposure and monthly income.
JEPQ Key Features
JEPQ targets stocks from the Nasdaq-100 index and gives investors:
A tech-heavy portfolio where technology stocks make up about 52% [7]
Active management that spots undervalued or lower-volatility stocks
ESG factors play a role in stock selection
Access to high-growth sectors with less risk than the broader market
The ETF’s performance speaks for itself. It has returned 44% since launch, while its competitor, the Global X Nasdaq 100 Covered Call ETF (QYLD), returned 20% [6]. JEPQ strikes a balance with its 17.8% standard deviation in the last year [6].
JEPQ Income Strategy
Like in JEPI, JEPQ uses equity-linked notes (ELNs) to run its covered call strategy. The fund sells out-of-the-money call options on the Nasdaq-100 index [8]. This gets more option premiums and thus encourages more monthly income, though it might cap gains during strong market rallies.
Monthly payments vary quite a bit. They range from $0.34 to $0.56 per share in 2024 [8]. The ETF showed a 30-day SEC yield of 11.39% as of October 2024 [8].
JEPQ Tax Efficiency
JEPQ taps into the tax benefits of ETFs through in-kind redemptions [8]. But note that the covered call strategy’s income counts mostly as ordinary income [8]. This makes JEPQ nowhere near as tax-efficient as ETFs paying qualified dividend income.
JEPQ Expense Ratio
The fund’s annual expense ratio sits at 0.35% [8]. That’s great value for an actively managed ETF using complex derivative strategies. You’ll pay $35 yearly for every $10,000 invested [8].
JEPQ Best Use Case
This ETF works best for investors who:
Want Nasdaq-100 exposure with less volatility
Like getting monthly income instead of waiting for share prices to rise
Can handle the tax impact by using tax-advantaged accounts like Roth IRAs [8]
The covered call strategy might limit total returns in strong bull markets. There’s also some counterparty risk with ELNs [8].
NEOS S&P 500 High Income ETF (SPYI)
Image Source: NEOS Investments
The NEOS S&P 500 High Income ETF (SPYI) launched in August 2022 and has grown faster into a leading covered call fund with assets exceeding $4.99 billion [9]. Income-focused investors have flocked to this ETF because it offers monthly distributions and tax benefits.
SPYI Key Features
SPYI stands out by:
Replicating the S&P 500 index as its core equity exposure
Using evidence-based laddered call writing strategy
Paying monthly distributions with a current rate of 12.05% [9]
You retain control over upside appreciation in rising markets
Using SPX index options with European-style expiration [2]
The fund operates quasi-actively, which lets managers adjust the options overlay tactically instead of following strict rules-based formulas [2]. NVIDIA, Microsoft, and Apple make up over 21% of the portfolio, mirroring the S&P 500’s largest components [9].
SPYI Income Strategy
SPYI takes a sophisticated approach to options writing compared to mechanical covered call ETFs. The fund managers sell multiple call options with varying levels of moneyness and coverage during low market volatility periods. This generates income while preserving upside potential [10]. They can sell fewer options or write them further out-of-the-money as volatility increases to meet income targets [10].
This adaptable strategy has helped SPYI outperform traditional buy-write strategies in recent market rallies [10]. The fund distributes $0.51 per share monthly, about 1% of its value each month [9].
SPYI Tax Efficiency
SPYI’s tax efficiency makes it particularly attractive. The fund utilizes SPX index options taxed under Section 1256, which offers a 60/40 blended capital gains rate [2]. Much of the distributions—98% in recent payouts—has been classified as return of capital [9].
Return of capital distributions reduce your cost basis instead of being immediately taxable, which can defer tax consequences [2]. This structure works exceptionally well for taxable accounts.
SPYI Expense Ratio
The fund’s 0.68% expense ratio [9] reflects its active management approach and sophisticated options strategy. Investors pay $68 annually on a $10,000 investment [2].
SPYI Best Use Case
SPYI works best for:
Income-focused investors who want monthly cash flow
Taxable accounts that benefit from tax-efficient distributions
Portfolios needing core S&P 500 exposure with better income
Investors seeking alternatives to traditional equity allocations [9]
The fund’s laddered call writing strategy helps maintain capital appreciation prospects, making it suitable for investors who want both income and growth potential.
NEOS Nasdaq 100 High Income ETF (QQQI)
Image Source: NEOS Investments
The NEOS Nasdaq 100 High Income ETF (QQQI) has become a powerhouse in the tech-focused covered call space since its January 2024 launch. The fund now manages over $4.29 billion in assets [11]. This remarkable growth shows how investors want tech exposure paired with substantial monthly income.
QQQI Key Features
QQQI offers a detailed approach to income generation through:
Investment in Nasdaq-100 Index constituents, which gives exposure to top tech names like Nvidia (9.05%), Microsoft (8.24%), and Apple (7.26%) [12]
Evidence-based call option strategy that has both sold and purchased NDX index options
Monthly distributions with a current annual yield of about 13.90% [11]
Opportunity for equity appreciation in rising markets
Active management by NEOS investment professionals
The fund wants to create high monthly income while you retain opportunities to participate when market conditions look favorable [13].
QQQI Income Strategy
QQQI stands apart from traditional covered call ETFs by using a sophisticated options writing approach. The strategy consists of:
Selling covered calls on the Nasdaq-100 Index to create premium income
Writing calls that stay out-of-the-money to preserve upside potential
Keeping part of the equity portfolio uncovered from written calls
Buying long call options based on their evidence-based model [14]
This flexible approach makes QQQI different from standard covered call strategies that often limit upside potential completely [14]. The fund pays substantial monthly distributions, with recent monthly payouts reaching $0.62-$0.64 per share [15].
QQQI Tax Efficiency
QQQI shines with its tax-efficient structure. The fund employs:
NDX index options classified as Section 1256 contracts, which qualify for favorable 60% long-term/40% short-term capital gains treatment whatever the holding period [13]
Active tax-loss harvesting throughout the year on call options and equity positions [14]
Distributions classified as return of capital (100% in recent distributions) [12]
This approach substantially improves after-tax returns compared to traditional income investments [16].
QQQI Expense Ratio
QQQI’s expense ratio stands at 0.68% [12], costing $68 annually per $10,000 invested [17]. Though higher than traditional index ETFs, this fee matches other actively managed options-based strategies.
QQQI Best Use Case
QQQI serves best for:
Investors who want high monthly income from tech-focused equities
Portfolios that need tax-efficient income solutions
People seeking Nasdaq-100 exposure with income priority over pure capital appreciation
Investors looking to add an income-focused alternative to existing tech holdings [14]
The fund performs well in taxable accounts where its tax efficiency stands out and retirement accounts that need steady income without giving up long-term growth potential.
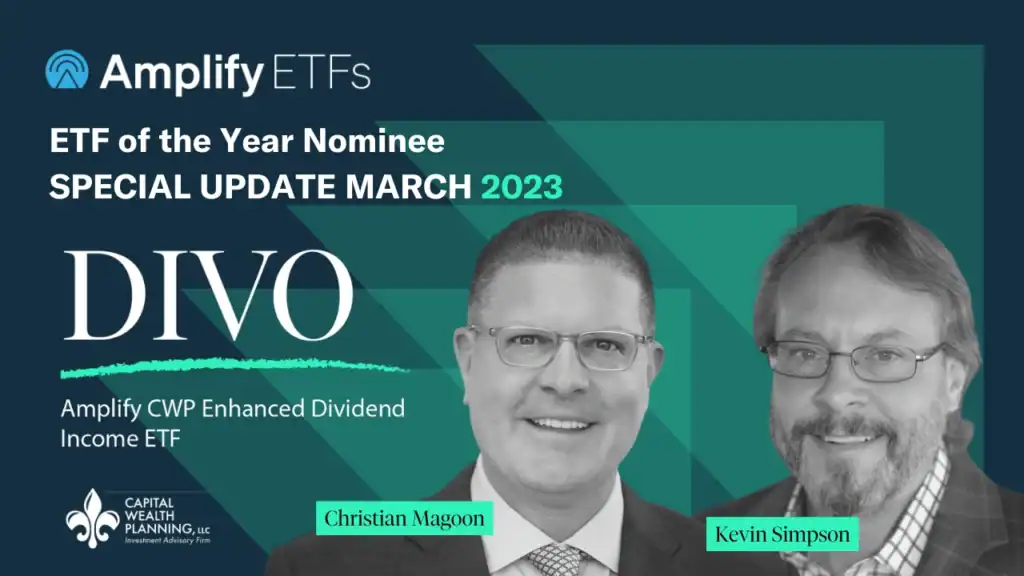
Amplify CWP Enhanced Dividend Income ETF (DIVO)
Image Source: Amplify ETFs
The Increase CWP Enhanced Dividend Income ETF (DIVO) uses a unique approach compared to other covered call ETFs by selecting blue-chip stocks and writing options selectively. This actively managed fund has earned a prestigious 5-star Morningstar rating as of June 2025 and has grown to nearly $3 billion in assets since its December 2016 launch [1].
DIVO Key Features
DIVO distinguishes itself in the covered call ETF world through:
A focused portfolio of 20-25 premium large-cap companies [1]
Active management by Capital Wealth Planning (CWP) under Kevin Simpson’s leadership [18]
Strict selection criteria based on dividend growth, earnings momentum, and management quality [18]
Strategic sector allocations that reflect CWP’s macroeconomic outlook [18]
5-star Morningstar rating in the derivative income fund category [3]
Many covered call ETFs simply track indices, but DIVO analyzes fundamentals to select companies with strong balance sheets and consistent dividend growth records [4].
DIVO Income Strategy
DIVO’s tactical approach to covered call writing makes it unique. The fund writes calls on specific holdings based on:
Market volatility levels
Technical analysis and valuation metrics
Stock-specific near-term catalysts [18]
This strategic approach aims to generate 2-3% annual income from dividends and 2-4% from option premiums [1]. The managers reduce call writing when volatility is low [19].
DIVO Tax Efficiency
DIVO provides better tax treatment than many competitors. Recent data shows that 78% of distributions were classified as return of capital [3]. This reduces an investor’s cost basis instead of being immediately taxable.
DIVO Expense Ratio
The fund’s 0.55% expense ratio [1] reflects its active management approach while remaining reasonable. Investors pay $55 annually per $10,000 invested.
DIVO Best Use Case
DIVO works best for:
Retirees who need steady income with lower volatility [19]
Investors who prefer quality over maximum yield (current distribution rate: 4.85%) [3]
People seeking professional management of stock selection and options writing
Portfolios that need a defensive equity component with boosted income [20]
The fund’s conservative strategy makes it a smart choice for investors who want to preserve capital while generating steady income.
Global X Russell 2000 Covered Call ETF (RYLD)
Image Source: Global X ETFs
Small-cap investors looking for steady income streams might find the Global X Russell 2000 Covered Call ETF (RYLD) an interesting choice. This ETF combines the rewards of the small-cap market segment with strong monthly income potential.
RYLD Key Features
RYLD works with a “covered call” or “buy-write” strategy by:
Purchasing stocks in the Russell 2000 Index or the Global X Russell 2000 ETF [21]
Writing corresponding call options on the Russell 2000 Index [21]
Tracking the Cboe Russell 2000 BuyWrite Index [21]
Offering small-cap exposure at attractive valuations (P/E ratio of just 11, versus S&P 500’s P/E of 20) [22]
The fund started in April 2019 [5] and now manages $1.25 billion in assets [5] with 83.91 million shares outstanding [5].
RYLD Income Strategy
RYLD sells at-the-money call options on the Russell 2000 index [6] and uses small-cap volatility to collect premiums [23]. This approach results in monthly distributions that change based on market conditions [23].
RYLD’s current yield stands at 12.46% [5], and this is a big deal as it means that it outperforms traditional small-cap ETFs. Monthly distributions reached $0.15 per share [5], while year-to-date distributions added up to $1.07 [5].
RYLD Tax Efficiency
Much of RYLD’s distributions fall under return of capital (ROC) classification [6]. These distributions don’t face immediate taxation as income but lower the fund’s net asset value over time [6]. This makes RYLD a tax-friendly option for taxable accounts.
RYLD Expense Ratio
The fund’s expense ratio is 0.60% [5][6], which matches its specialized strategy and complexity. RYLD maintains a 105% portfolio turnover rate [5].
RYLD Best Use Case
RYLD works best for:
Income-focused investors who want predictable monthly payouts more than growth [6]
Portfolios needing small-cap exposure with less volatility
Investors wanting to vary beyond large-cap covered call ETFs [22]
People ready to trade growth potential for high current income [6]
Roundhill Bitcoin Covered Call Strategy ETF (YBTC)
Image Source: Roundhill Investments
The Roundhill Bitcoin Covered Call Strategy ETF (YBTC) is making waves as the first U.S. ETF that runs a covered call strategy on Bitcoin exposure [24]. Since its launch in January 2024, this groundbreaking fund has pulled in $303.27 million in assets under management [25]. Investors now have a fresh way to tap into cryptocurrency returns while earning significant income.
YBTC Key Features
YBTC stands out because it:
Uses a synthetic covered call structure to get exposure to Bitcoin ETPs
Pays weekly distributions with an impressive 58.69% distribution rate [8]
Actively manages options contracts instead of holding cryptocurrencies directly
Tracks Bitcoin price movements with a weekly cap [8]
We invested mainly in options contracts that use Bitcoin ETFs as reference assets [26]
The fund’s “synthetic” structure comes from getting Bitcoin exposure through options instead of holding cryptocurrency or Bitcoin ETF shares directly [8].
YBTC Income Strategy
YBTC’s strategic plan generates weekly income by:
Selling call options on Bitcoin ETFs (such as iShares Bitcoin Trust ETF)
Buying put options at the same strike price
Creating synthetic long exposure to Bitcoin’s price movements [27]
This approach helps YBTC collect premiums that turn into substantial weekly payouts. Recent distributions reached $0.51 per share in August 2025 [27], and annual dividend payments hit $20.57 [25].
YBTC Tax Efficiency
YBTC runs as a Regulated Investment Company (RIC) [28]. The fund’s distributions are a big deal as it means that they exceed its income and gains, which leads to:
Most distributions getting return of capital treatment
Lower investor cost basis instead of immediate taxes
Future capital gains taxes when sold [8]
Recent distributions were 100% return of capital [27], which pushes tax payments down the road for investors.
YBTC Expense Ratio
YBTC’s 0.96% expense ratio [26][8] means you pay $96 yearly per $10,000 invested. This cost runs higher than regular ETFs but makes sense given the strategy’s specialized nature and hands-on management.
YBTC Best Use Case
YBTC works best for:
Investors who want super-high yields
People seeking Bitcoin exposure with less wild swings
Investors who get the tax impact of return-of-capital distributions
Portfolios looking to vary beyond standard investments [27]
All the same, investors should know that YBTC’s capped upside means it might lag behind when Bitcoin prices shoot up quickly.
NEOS Real Estate High Income ETF (IYRI)
Image Source: NEOS Investments
The NEOS Real Estate High Income ETF (IYRI) stands out as a compelling option for investors looking to gain real estate exposure with improved income potential. Since its launch on January 14, 2025, this actively managed fund has gathered over $103 million in assets under management [29].
IYRI Key Features
IYRI’s unique characteristics include:
Investment in U.S. listed REITs that track the Dow Jones U.S. Real Estate Capped Index [29]
Monthly distributions at 11.13% with $0.47 per share (0.93%) [29]
Active management backed by analytical call option overlay
A diverse portfolio of companies that invest, develop, own, or manage real estate [7]
A balanced index structure where no single stock makes up more than 10% [7]
IYRI Income Strategy
The fund’s sophisticated covered call approach works through writing call options on the Dow Jones U.S. Real Estate Capped Index or its tracking ETFs [7]. The managers focus on writing covered calls on the Index [30]. Call spread strategies might come into play under specific conditions to maximize returns [7]. This approach delivers consistent premium income, though it caps upside potential beyond certain levels [30].
IYRI Tax Efficiency
IYRI shines in its tax treatment while delivering high yields. The fund’s distributions are 96% classified as return of capital [29]. This classification means investors see their cost basis reduced instead of facing immediate taxes [31]. Traditional REITs lag behind as IYRI’s structure boosts after-tax returns by up to 20% [31].
IYRI Expense Ratio
The fund’s expense ratio sits at 0.68% [29][7]. This rate makes sense given its active management style and options strategy complexity.
IYRI Best Use Case
IYRI fits perfectly for:
Income-focused investors who can handle moderate volatility (18.17% 200-day volatility) [31]
People seeking tax-smart monthly income
Investors wanting real estate exposure without buying property
Portfolio managers needing quality REIT diversification in healthcare and communications infrastructure [31]
Amplify CWP International Enhanced Dividend Income ETF (IDVO)
Taking the covered call strategy worldwide, the Amplify CWP International Enhanced Dividend Income ETF (IDVO) lets investors access high-quality international dividend stocks with a strategic options approach. The ETF manages $334.02 million in assets [32] and adds the geographical diversity that many income portfolios need.
IDVO Key Features
This ETF differs from other covered call funds through its unique characteristics. The fund spreads investments across developed and emerging markets with UK at 16%, Canada at 13.5%, Brazil at 10%, China at 8.5%, and Japan at 7.3% [33]. U.S. exposure stays capped at 6.5% [33]. The fund’s active management provides high flexibility with a 104% turnover rate [32]. Investors receive monthly income distributions [34].
IDVO Income Strategy
Fund managers write covered calls only when premium opportunities arise [33], unlike the blanket approach many passive income ETFs use. This flexible strategy aims to add 2-4% yearly yield from option premiums on top of 3-4% from dividend income [33]. The fund’s annualized dividend payout grew by 10.9% from 2023 to 2024 [33]. Recent monthly distributions reached $0.17 per share [33].
IDVO Tax Efficiency
Regarding taxes, IDVO distributions mainly consist of ordinary income and return of capital [33]. Recent distributions showed an estimated 88% return of capital [34]. This structure works well in tax-advantaged accounts like Roth IRAs [33].
IDVO Expense Ratio
The fund’s expense ratio stands at 0.66% [32], which aligns with typical pricing for actively managed international strategies.
IDVO Best Use Case
The fund serves several investor types well:
Retirees who need steady monthly income [33]
Investors looking for protection against U.S. market downturns [33]
Those who want international diversity with strong income potential
iShares Advantage Large Cap Income ETF (BALI)
Image Source: BlackRock
BlackRock’s iShares Advantage Large Cap Income ETF (BALI) stands out as a strategic choice for income-focused investors who want exposure to large-cap U.S. equities. The actively managed fund maintains $403 million in assets under management as of August 2025 [35] and strikes an impressive balance between income and risk management.
BALI Key Features
The fund uses BlackRock’s Systematic Active Equities (SAE) platform [36] to deliver:
Distribution yield of 7.86% [35]
12-month trailing yield of 8.57% [35]
Beta of 0.86-0.87 relative to the S&P 500 [10]
30-day standard deviation of 16.8% versus S&P 500’s 20.2% [10]
BALI Income Strategy
BALI gets more and thus encourages more income through two methods. The fund invests in carefully selected large-cap stocks using a proprietary dividend rotation model [36]. Monthly call options on the S&P 500 Index [36] boost the yields further. This approach has delivered steady monthly distributions, with a recent payout of $0.38 [37] – a 26% increase from April 2025 [37].
BALI Tax Efficiency
The fund’s ETF structure provides tax advantages, as ETFs typically account for less than 1% of capital gains distributions while holding 29% of U.S. managed fund assets [38]. The derivatives activity might result in distributions taxed as ordinary income [37].
BALI Expense Ratio
The fund’s 0.35% expense ratio [35] beats the 0.59% category average for U.S. large-cap equity ETFs [37]. Investors save roughly $240 annually per $100,000 invested [37].
BALI Best Use Case
We designed BALI for investors who want consistent returns without compromising capital preservation [10]. The fund serves well as a core equity position for investors dealing with rising interest rates and geopolitical uncertainties [10].
Global X S&P 500 Covered Call ETF (XYLD)
Image Source: Global X ETFs
The Global X S&P 500 Covered Call ETF (XYLD) stands out among S&P 500-focused covered call funds. Its simple yet powerful strategy has delivered monthly income to investors for more than a decade. XYLD proves itself as one of the best covered call ETFs when investors need broad market exposure.
XYLD Key Features
XYLD uses a traditional “buy-write” strategy that:
Buys all S&P 500 Index stocks at nearly equal weights [9]
Writes European-style S&P 500 Index call options against its entire holdings each month [9]
Gives you access to blue-chip companies like NVIDIA (8.10%), Microsoft (6.98%), and Apple (6.40%) [39]
Uses cash-settled options that stay locked until expiration [9]
Has paid monthly distributions for 11 straight years [40]
XYLD Income Strategy
The fund pays out the smaller amount between half the call option premium or 1% of its net asset value right after collecting the premium [9]. This approach currently yields a 13.58% trailing 12-month distribution rate [40]. XYLD runs on market volatility because option premiums tend to rise when markets become unpredictable [9].
XYLD Tax Efficiency
The fund’s distributions typically include a return of capital [40]. This can benefit investors tax-wise by lowering their cost basis instead of creating immediate tax obligations.
XYLD Expense Ratio
With a 0.60% annual expense ratio [40], XYLD ranks in the second-cheapest fee quintile compared to similar funds [39].
XYLD Best Use Case
This ETF serves as the life-blood of income-focused portfolios [9]. It suits investors who:
Want reliable monthly income more than growing their capital
Need S&P 500 exposure with less volatility than the index [41]
Look for income that works in different market conditions [9]
Comparison Table
ETF (Ticker) | AUM | Distribution/Yield Rate | Expense Ratio | Investment Focus | Tax Treatment |
JEPI | $33B | 8.13% (12-month rolling) | 0.35% | U.S. large-cap stocks with S&P 500 options overlay | Ordinary income |
JEPQ | $24B | 11.39% (30-day SEC yield) | 0.35% | Nasdaq-100 stocks with options overlay | Ordinary income |
SPYI | $4.99B | 12.05% | 0.68% | S&P 500 index with laddered call strategy | 98% Return of capital |
QQQI | $4.29B | 13.90% | 0.68% | Nasdaq-100 stocks with selective call writing | 100% Return of capital |
DIVO | $3B | 4.85% | 0.55% | 20-25 blue-chip stocks with selective call writing | 78% Return of capital |
RYLD | $1.25B | 12.46% | 0.60% | Russell 2000 index with covered calls | High Return of capital |
YBTC | $303.27M | 58.69% | 0.96% | Bitcoin ETF exposure with covered calls | 100% Return of capital |
IYRI | $103M | 11.13% | 0.68% | U.S. REITs with covered calls | 96% Return of capital |
IDVO | $334.02M | Not mentioned | 0.66% | International dividend stocks with tactical options | 88% Return of capital |
BALI | $403M | 7.86% | 0.35% | U.S. large-cap stocks with S&P 500 options | Ordinary income |
XYLD | Not mentioned | 13.58% | 0.60% | S&P 500 index with covered calls | Return of capital |
Conclusion
Covered call ETFs give investors great ways to get monthly income while staying connected to different market segments. Let’s take a closer look at 11 outstanding options that cover everything from broad market indices to specific sectors.
These funds show some impressive distribution rates. YBTC leads with a stunning 58.69% yield, while conservative picks like DIVO deliver 4.85%. The best part? You can match yields to your comfort level with risk.
Many of these ETFs come with a tax advantage that’s hard to ignore. SPYI, QQQI, and IYRI mostly pay out return-of-capital distributions. This setup helps defer your tax payments and boosts after-tax returns. Taxable accounts love this feature, though retirement accounts benefit from steady income too.
The fees stay reasonable even with complex strategies at work. JEPI and BALI charge just 0.35%, while specialized options like YBTC cost 0.96% – worth it if you want Bitcoin exposure.
Your perfect covered call ETF really comes down to what you want from your investments. Retirees might like JEPI or DIVO’s lower volatility. Growth-focused investors could lean toward JEPQ or QQQI. IDVO works well for international exposure, while IYRI fits nicely for real estate allocation.
Keep in mind these ETFs work best as part of a bigger plan. Smart investors use them alongside other growth investments to build a solid portfolio.
The covered call ETF world keeps growing with new offerings that balance income, growth potential, and risk management. Markets will face ups and downs in 2026, but these 11 funds give you solid tools to handle uncertain times while keeping steady cash flowing from your investments.
Key Takeaways
Covered call ETFs have emerged as powerful income-generating tools, offering investors monthly distributions while maintaining equity market exposure across various sectors and strategies.
• Tax-efficient income dominates: Many top funds like SPYI (98% ROC) and QQQI (100% ROC) distribute primarily return-of-capital, deferring taxes and enhancing after-tax returns.
• Yield ranges from conservative to aggressive: Distribution rates span from DIVO’s steady 4.85% to YBTC’s exceptional 58.69%, allowing investors to match risk tolerance with income needs.
• Expense ratios remain competitive: Despite complex strategies, fees range from just 0.35% (JEPI, BALI) to 0.96% (YBTC), providing reasonable value for active management.
• Diversification opportunities abound: Options include broad market exposure (SPYI, XYLD), tech-focused strategies (JEPQ, QQQI), international holdings (IDVO), and specialized sectors like REITs (IYRI).
• Strategic portfolio allocation works best: These ETFs function optimally as components within diversified portfolios rather than standalone investments, complementing core growth positions while generating consistent cash flow.
The covered call ETF landscape offers sophisticated income solutions that balance monthly distributions with growth potential, making them valuable tools for navigating 2026’s investment opportunities while maintaining steady income streams.
FAQs
Q1. What are the top ETFs for generating monthly income? Several covered call ETFs offer attractive monthly income, including JEPI, JEPQ, and SPYI. These funds use options strategies to enhance yields from their underlying stock portfolios, with distribution rates ranging from 8-12% annually.
Q2. How do covered call ETFs balance income and growth potential? Covered call ETFs like DIVO and XYLD aim to provide steady income while maintaining some upside potential. They achieve this by selectively writing call options on their holdings, allowing for income generation while preserving opportunities for capital appreciation in rising markets.
Q3. Are covered call ETFs tax-efficient investments? Many covered call ETFs, such as SPYI and QQQI, distribute a significant portion of their payouts as return of capital. This can be tax-efficient as it reduces an investor’s cost basis rather than being immediately taxable, potentially deferring tax consequences.
Q4. What role can covered call ETFs play in a retirement portfolio? Covered call ETFs can serve as valuable income-generating components in retirement portfolios. Funds like JEPI and BALI offer reduced volatility compared to the broader market while providing consistent monthly distributions, helping retirees meet income needs.
Q5. How do expense ratios for covered call ETFs compare to traditional index funds? Covered call ETFs typically have higher expense ratios than passive index funds due to their active management and options strategies. However, many still offer competitive fees, with some like JEPI and BALI charging just 0.35%, which is reasonable given their income-enhancing approach.
References
[1] – https://amplifyetfs.com/wp-content/uploads/files/DIVO-Presentation-Public.pdf
[2] – https://www.fool.com/investing/how-to-invest/etfs/how-to-invest-in-spyi-etf/
[3] – https://amplifyetfs.com/divo/
[4] – https://www.markets.com/education-center/divo-etf-review-pros-and-cons-of-divo-etf-investment
[5] – https://www.marketwatch.com/investing/fund/ryld
[6] – https://www.ainvest.com/news/ryld-covered-call-powerhouse-income-volatile-market-2508/
[7] – https://www.etftrends.com/monthly-income-channel/neos-lists-real-estate-high-income-etf-iyri/
[8] – https://www.roundhillinvestments.com/etf/ybtc/
[9] – https://globalxetfs.com.br/spotlight-on-xyld-an-sp-500-covered-call-strategy/
[10] – https://www.ainvest.com/news/evaluating-attraction-bali-high-yield-volatile-market-systematic-approach-income-downside-protection-2509/
[11] – https://stockanalysis.com/etf/qqqi/
[12] – https://neosfunds.com/qqqi/
[13] – https://neosfunds.com/wp-content/uploads/QQQI-Fact-Sheet.pdf
[14] – https://www.etf.com/sections/etf-industry-perspective/qqqi-seeking-income-outcome
[15] – https://portfolioslab.com/symbol/QQQI
[16] – https://neosfunds.com/the-importance-of-tax-efficiency-within-your-income-portfolio/
[17] – https://www.fool.com/investing/how-to-invest/etfs/how-to-invest-in-qqqi-etf/
[18] – https://etfportfolioblueprint.com/posts/amplify-cwp-enhanced-dividend-income-etf-divo-review
[19] – https://etfexpress.com/2022/12/09/amplify-etfs-divo-hits-sweet-spot/
[20] – https://www.cnbc.com/2023/05/06/this-dividend-paying-etf-may-help-investors-during-wild-market-swings.html
[21] – https://www.globalxetfs.com/funds/ryld/
[22] – https://www.etftrends.com/etf-of-the-week/global-x-russell-2000-covered-call-etf-ryld-etf-of-the-week/
[23] – https://www.globalxetfs.com/articles/ryld-implementing-a-covered-call-strategy-on-small-cap-equities/
[24] – https://etfgi.com/news/stories/2024/01/roundhill-investments-launches-bitcoin-covered-call-etf-ybtc
[25] – https://stockanalysis.com/etf/ybtc/
[26] – https://www.schwab.wallst.com/schwab/Prospect/research/etfs/reports/reportRetrieve.asp?reportType=etfrc&symbol=YBTC
[27] – https://www.ainvest.com/news/ybtc-leveraging-bitcoin-volatility-weekly-income-high-yield-strategy-2508/
[28] – https://www.etf.com/sections/etf-basics/how-are-bitcoin-etfs-taxed-what-investors-need-know
[29] – https://neosfunds.com/iyri/
[30] – https://marketchameleon.com/Overview/IYRI/About/
[31] – https://www.ainvest.com/news/balancing-high-yield-downside-risk-real-estate-etfs-assessing-iyri-tax-efficient-strategy-2025-2508/
[32] – https://finance.yahoo.com/quote/IDVO/profile/
[33] – https://www.tradingnews.com/news/idvo-etf-5-53-percent-high-yield-covered-call-strategy-with-global-edge
[34] – https://amplifyetfs.com/idvo/
[35] – https://www.blackrock.com/us/individual/products/333207/ishares-advantage-large-cap-income-etf
[36] – https://www.ishares.com/us/insights/outcome-etfs-income-strategies
[37] – https://www.ainvest.com/news/bali-etf-0-3820-distribution-beacon-income-resilience-volatile-markets-2505/
[38] – https://www.ishares.com/us/investor-education/etf-education/how-are-etfs-tax-efficient
[39] – https://www.morningstar.com/etfs/arcx/xyld/quote
[40] – https://www.globalxetfs.com/funds/xyld/
[41] – https://wyzeinvestors.com/xyld-etf/
