Technical Analysis In Forex Trading
Trading Forex is not gambling; there are hundreds of tools available for you in every broker just for analyzing the markets and study its possible directions. Technical analysis is the name given to the approach that uses most of those tools.
It’s by far the most popular method for studying currency pairs, and for good reason, as it is the basis for most indicators and trading software you see these days.
If you want to start trading and don’t know what technical analysis is or how to use it, then don’t worry, for this will give you all the knowledge you need.
1. What Is Technical Analysis?
Technical analysis is an approach to market analysis that’s based on the idea that “history repeats itself”. It’s done by studying past price movements for confirmation on future developments for currency pair.
Basically, whenever you analyse a chart to spot patterns or see moving averages and other indicators over it, you’re using or looking at a technical analysis of the market.
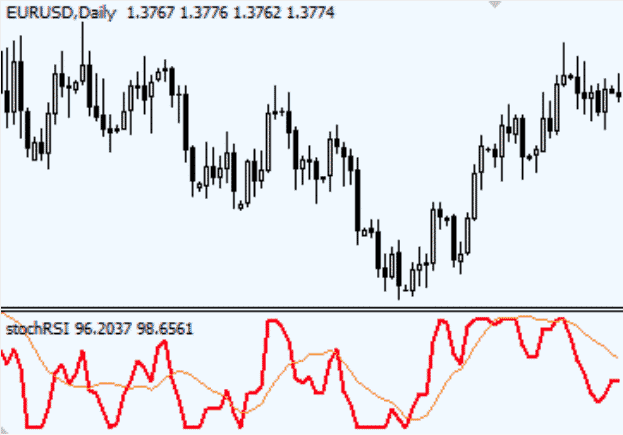
Technical analysis in Forex trading is used to spot key levels and figures that can give clues regarding where the price of a currency pair is headed, and it does so only using the information on graphs.
2. What’s The Difference Between Technical Analysis And Fundamental Analysis?
Technical analysis and fundamental analysis can be seen as night and day. Whereas the former uses numbers and past price action to determine where an asset is headed, the latter studies the events that could alter the course of a currency pair.
In other words, fundamental analysis is also known as “trading the news”, which refers to placing your orders depending on important news releases that are relevant to a country’s political and economic development, thus affecting its coin.
However, it’s worth noting that you needn’t choose between the two; most experienced traders use technical analysis to confirm their predictions from fundamental analysis.
3. Technical Analysis And Sentiment Analysis: A Close Combination.
On the other hand, these two types of analysis are harder to differentiate.
Sentiment analysis studies how the market “feels”; the reasoning behind that is that if the market believes that a currency isn’t valuable, news releases and past price movements can fail to be relevant.
The similarity lies in the fact that market sentiment is also measured through price action on a chart, so technical analysis can be seen as necessary to use sentiment analysis—even if they come from different ideas.
4. Why Is Technical Analysis Important?

Technical analysis is the only way to obtain key information if one wishes to trade with less risk:
- Identifying Trends.
First off, technical analysis is used to identify and confirm trends in the market.
Technical analysts are able to spot if an asset has been trading in an uptrend (price increasing with time), a downtrend (price is decreasing with time), or a side-trend (price doesn’t increase or decrease continuously, but it oscillates between the same prices)—also known as “consolidation”.
The previous paragraph translates into the trader knowing whether an asset is devaluing or not, and therefore, he’s able to know if he wants to sell or buy the asset.
- Identifying Supports And Resistances.
Knowing if you should buy or sell is not the only relevant information for placing trade orders.
Technical analysis also offers insight into where the supports and resistances are sitting in a market trend. In other words, technical analysis also lets you know the levels at which price action can reverse or lose momentum.
These levels are used to place stop-loss and take-profit orders, thus telling the trader what his target should be and which movements can prove to be detrimental to his position.
As an extra, knowing when a support or resistance is broken (through technical analysis) grants critical information on how a trend will develop in the future.
5. What Makes Technical Analysis?
- Charts And Graphs (Price Action).
As previously mentioned, most of the time you see someone looking at a graph, you’re also seeing someone doing technical analysis.
Charts are the backbone of technical analysis due to the fact that it offers all the information that makes the basis for this approach.
Charts evaluate price action, which we already mentioned several times. For those who don’t know, price action is the movements and performance of an asset’s price, and it’s expressed on the graph in the form of candlesticks, bars, or any other indicator that a trader chooses.
- Technical Indicators.
Moving averages, Bollinger Bands, Fibonacci Retracements, and many more are what’s known as “technical indicators”.
Technical indicators are tools used to simplify and facilitate the process of reading the information available on the chart. For example, a simple moving average will average prices into a single line instead of bars, and Bollinger Bands draw parallel lines showing the average supports and resistances.
Technical indicators aren’t mandatory for technical analysis, for they can be replaced by chart patterns, but using them correctly can make trading much easier.
- Chart Patterns.
Chart patterns—also known as price patterns—are specific figures drawn by price action on a chart.
Chart patterns are useful because they mark important events in the market that may occur too quickly for it to be important enough to become a news release.
Chart patterns usually signal what the market is going to do next. For example, if a chart shows the price to increase, fall, and then increase again to the same level, it’s known as a “double top”. That pattern usually means that the bulls are trying to gain lost momentum, and price usually drops after this.

6. How Can You Perform Technical Analysis?
- Using The Right Charts.
Not all charts are the same, and some are easier to read than others.
Candlestick charts are the most popular thanks to how much information they offer, but many traders can see them as “too much information” and gravitate towards simpler charts like renko charts or simple bars.
Make sure to study all types of charts and use the ones with which you feel most comfortable.
- Choosing Your Indicators.
As previously stated, indicators aren’t irreplaceable, but they do make everything easier for traders who can use them correctly.
Again, different traders will prefer different indicators for their careers, and while some indicators are popular, there isn’t one that fits all investors.
The most important part of using indicators is knowing what you need and what you needn’t. Many traders make the mistake of using too many indicators—or using one they don’t fully understand—and end up with an overcrowded screen that’s more difficult to read than price action alone.
- Studying Price Action For Known Patterns.
We already said that many professional traders skip indicators altogether and use nothing but price action to decide on their trades.
While we aren’t suggesting you do the same, we do advice traders to take their time and look at the charts alone in addition to using their favorite tools.
Many times an indicator can confirm a suspected pattern, or it could also save you from a missed prediction by telling you where to place your stop-loss. On the other hand, perhaps you see a double top forming, but all of your indicators signal that the market still has momentum built.
- Evaluating Key Levels For Placing Orders.
Once you’ve determined whether the trend goes up or down—and if you want to go long or short—your next step is to know where things can change and when it’s best to close your position.
Both indicators and chart patterns offer insight regarding where price can retrace or where it can boost, and these are levels you need to consider while placing your order.
Lastly, we can’t forget about support and resistances, even secondary and tertiary ones. If you know where each level is, then you know how to act once these levels are touched or broken.

7. Possible Disadvantages When Using Technical Analysis.
Technical analysis is often seen as the most complicated approach, but its shortcomings aren’t impossible to lessen as long as you can spot them.
Technical analysis is based on the past, and Forex trading is based on where prices will go in the future. As such, there can be occasions in which price action moves in the opposite direction you were expecting, so you need to place your stop-losses correctly.
However, by not neglecting your other types of market analysis, you can reduce that risk, which is why it’s recommended to use all three approaches.
General Tips in Technical Analysis in Forex Trading
- You may find better success if you keep your screens as simple as possible. Use only the tools you deem in-disposable.
- Don’t neglect other approaches, as fundamental, technical, and sentiment analysis compliment each other.
- Even if you don’t use technical analysis primarily, it’s still useful to know the most basic key levels of a trend.
- All patterns and indicators work in all chart time frames, but some work better with short time windows and others are better with long ones.
- Most brokers offer demo accounts, make sure to test all your tools on one before using them with real money.
Like this article?

Forex Rank
Related Posts

How to Trade MSTR Stock: A Beginner’s Guide to Smart Investing
MSTR stock’s value has shot up by over 2,200% since August 2020. This growth started right after the company began investing in Bitcoin. The stock’s

12 Critical Signs of Growing Institutional Bitcoin Investor Interest
12 Critical Signs of Growing Institutional Bitcoin Investor Interest Professional Bitcoin investors now control an impressive $27.4 billion in Bitcoin ETFs during Q4 2024. This

How to Invest in Bitbonds: A Beginner’s Guide to Bitcoin-Backed Bonds
The U.S. government faces a massive challenge – a staggering $9.31 trillion of federal debt that needs to be paid within 12 months. BitBonds could

AI Forex Trading Secrets: What Top Traders Won’t Tell You
The forex market gets more than $8 trillion in daily turnover. This vast financial arena now sees AI forex trading systems taking the lead, and all

How to Choose a Forex Broker in 2025: Avoid These Costly Mistakes
Did you know that 71% of retail client accounts lose money when trading CFDs? You need to pick the right forex broker to avoid becoming part of

Strategic Bitcoin Reserve Explained: From Policy to Practice
The U.S. government stands as the world’s largest state holder of Bitcoin through its Strategic Bitcoin Reserve, which now controls approximately 200,000 BTC. President Donald Trump’s


